
Open source monitoring at the HPE Customer Technology Center Böblingen
January 2, 2024The challenge
The HPE Customer Technology Center (CTC) Böblingen is a customer visit center in Germany where a wide range of HPE solutions are demonstrated. The core infrastructure of the CTC is based on HPE SimpliVity. Its performance, capacity and uptime has been monitored for some time using Prometheus and Grafana. You can find the implementation of the HPE SimpliVity-Prometheus exporter described in the HPE SimpliVity Prometheus exporter whitepaper. Over time, this monitoring environment was extended with the HPE array exporter for HPE storage arrays (HPE Alletra 6000, HPE Alletra 9000 and HPE Alletra MP).
Over the last few summers, the CTC lab team was challenged with how to cool the growing infrastructure. The cooling capacity initially planned was no longer sufficient given the new generation servers and storage that were deployed in the CTC. The team found that the lab temperature was rising to a level that caused several incidents where HPE ProLiant servers were automatically shutting down to avoid damages. To remedy this situation, the team looked for a CTC lab temperature warning system that would be easy to implement and would provide a "heads up" of any rise in temperature in the CTC and allow us to shutdown equipment that was not urgently needed for customer demos - ensuring that the booked customer demos would still be able to run.
Redfish® iLO RESTful API as a solution?
Each HPE ProLiant server has a lot of temperature sensors spread across the system board, CPU, memory and power supplies. This detailed temperature data is available and visualized on each ILO interface in the Power & Thermal section:
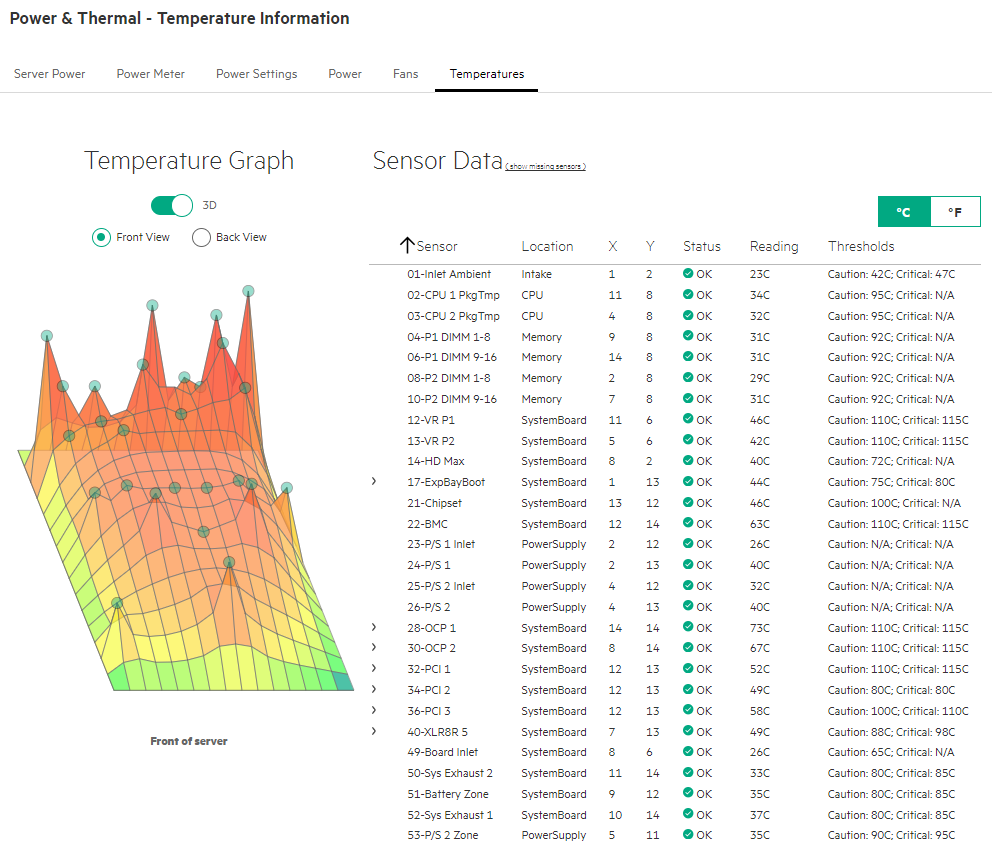
The first sensor, 01-Inlet Ambient temperature, is measuring the inlet temperature at the front of the server and can be used as an indicator of the temperature of the overall CTC environment. Now that I have identified a usable data point an automated reading of the temperature values is needed. Since I already used the the HPE Simplivity REST API to build the HPE SimpliVity-Prometheus exporter used to monitor the core infrastructure, it was only natural that I would look into the Redfish® iLO RESTful API. The Redfish® API ecosystem is an open industry-standard specification (published by the Distributed Management Task Force DMTF and provides remote server provisioning, inventory and monitoring.
A directory of the available Redfish® resources at an ILO interface can be retrieved with the following RESTful API command:
GET {{baseUrl}}/redfish/v1/resourcedirectory
I used Postman as a developer tool to retrieve and search the resource directory. The above RESTful API comand was used in Postman with a basic username/password authorization at one of the ILOs in the CTC, where the baseUrl is defined as https://iloIPaddress. I searched in the obtained resource directory for "thermal" in order to find the correct command to retrieve thermal data:
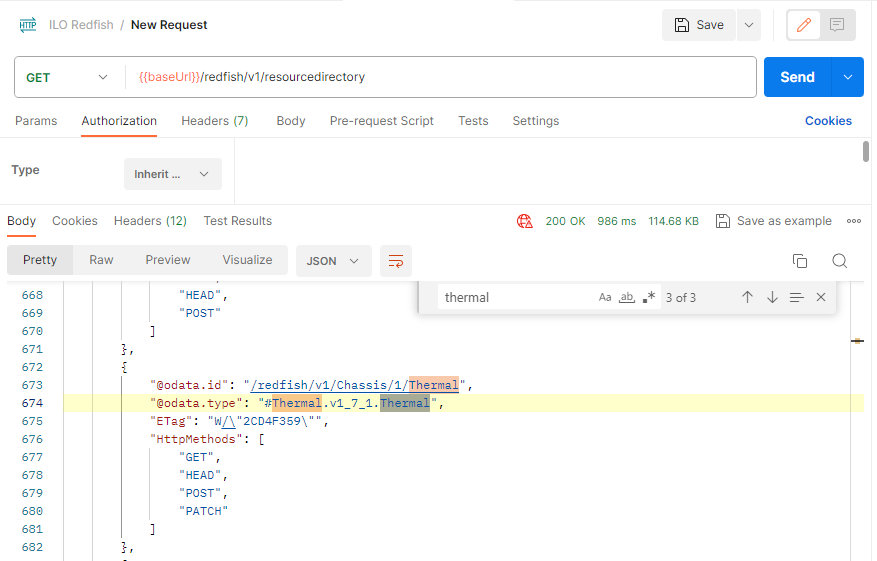
I found that I could retrieve thermal server data using the following RESTful command:
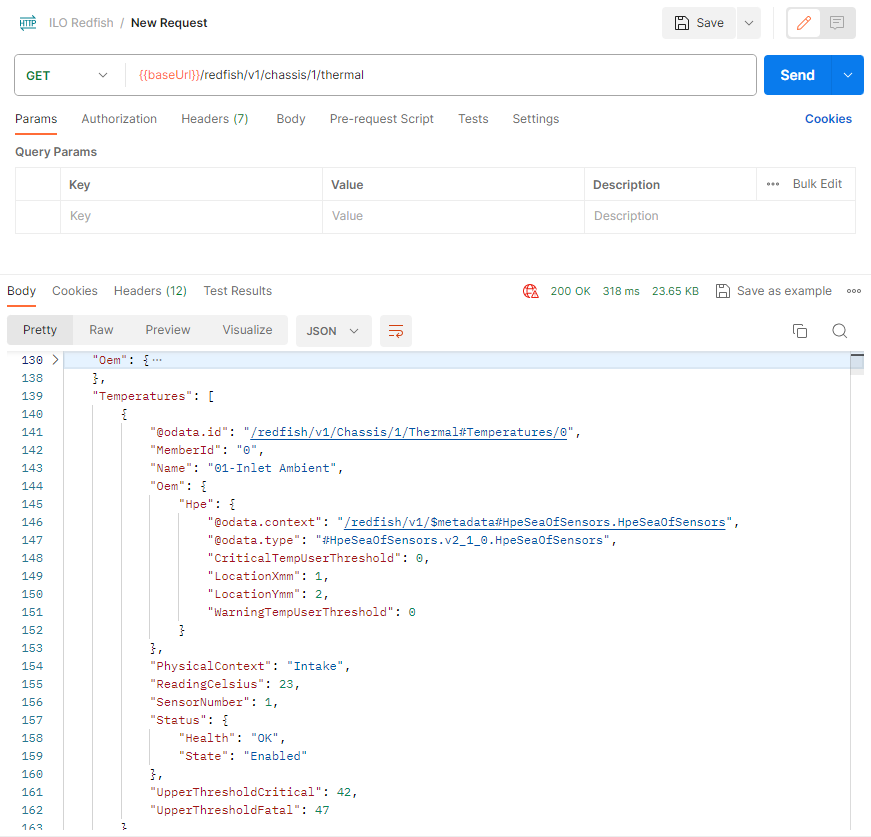
GET /redfish/v1/chassis/1/thermal
And using this Get command with Postman confirmed that I could get the values of all temperature sensors of the server:
Building the HPE server exporter
Once I had the Prometheus-Grafana based monitoring established in the Customer Technology Center and knew the RESTful command required to retrieve the data I was looking for, the only missing piece was a Prometheus exporter for the HPE ILO interfaces and the according Grafana dashboards. This required me to write another Prometheus exporter - one designed for the HPE ILO interface. I decided to use Python as the programming language for this connector, because I could build on the knowledge gained when I developed the HPE SimpliVity-Prometheus exporter.
First I had to decide which redfish library I wanted to use - the DMTF Redfish Python Library or the HPE Python Redfish library - as they cannot coexist both in a Python environment. I decided to use the DMTF Redfish Python library, since I didn't need the additional features of the HPE Python Redfish library for my use case. The retrieved data can easily made digestible for Prometheus with the prometheus_client Python library. The additional libraries, that I used are mainly for providing the input data in XML-format (etree library) and for the permanent monitoring loop (time, sys and os library) and logging (datetime library). Hence, I needed the following libraries included in my Python script:
from lxml import etree
import time
from datetime import datetime
from prometheus_client import Counter, Gauge, start_http_server, Info
import sys
import redfish
import os
I decided to use one username for all ILOs that I wanted to add into the monitoring realm. Login with read only access privileges were sufficient for the Prometheus exporter user defined local on the ILOs.
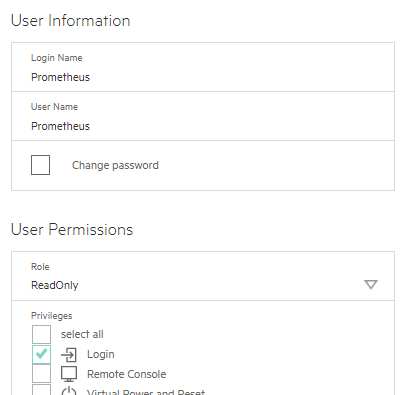
Testing the initial Prometheus exporter showed that I could consolidate multiple server ILOs into a single exporter while keeping the data collection time below 30 to 60 seconds. The ILO Prometheus exporter itself has a simple structure - I didn't want to complicate things if not absolutely necessary:
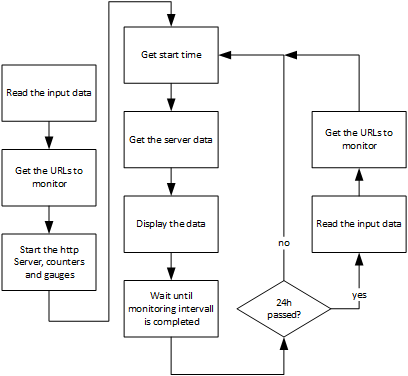
First, the exporter reads the input data; i.e. the ILO IP addresses and the ILO username and password. Next, the exporter retrieves the correct URLs for each monitored server and stores it in a Python directory. Afterwards, the script starts the http server and the corresponding Prometheus counters and gauges. Having completed these preparation steps, the script enters an endless loop that first captures the start time of the current iteration, second retrieves the data from the monitored server, third displays the captured data and waits until the current monitoring interval is completed. Additionally, I have added that at least once per day the input data and monitor URLs are refreshed. This allows me to change the list of monitored systems without starting and stopping the script. I just need to edit the input data file to adjust the list of monitored systems.
Main routine
As a result, the Python main routine of the ILO Prometheus exporter is as simple as shown below (I removed some of the log commands to improve the readability):
if __name__ == "__main__":
    input = getServerList()
    # Get the monitoring URLs of the server
    monitor_urls = get_server_urls(input['user'], input['password'], input['server'], input['lfile'])
    # Start the http_server and the counters, gauges
    start_http_server(input['port'])
    c = Counter('ilorest_sample','ILO REST sample number')
    node = Gauge('ilorest_node','ILO Node Data',['nodename','rack','nodemetric','metricdetail'])
    delta = Gauge('ConnectorRuntime','Time required for last data collection in seconds')
    inode = Info('node','Additional Node Info',['node'])
    # Start the endless loop
    while True:
        t0 = time.time()
        start0 = t0
        c.inc()
        for server in monitor_urls:
            try:
                server_metrics = get_server_data(input['user'], input['password'], monitor_urls[server], input['lfile'])
                display_results(node, inode, server_metrics, monitor_urls[server])
            except Exception as ex:
                log=logopen(input['lfile'])
                logwriter(log,'Exception')
                logwriter(log,str(ex.__context__))
                logclose(log)
                pass
        t1 = time.time()
        delta.set((t1-t0))
        while ((t1-t0) < input['mintervall']):
            time.sleep(1.0)
            t1 = time.time()
        # update once per day the input
        if ( t1 - start0 > 86400):
            start0 = t1
            input = getServerList()
            monitor_urls = get_server_urls(input['user'], input['password'], input['server'], input['lfile'])
As you can see, I used four Python functions within the main routine:
- getServerList
- get_server_urls
- get_server_data
- display_results
The first one - getServerList - is just reading the input data out of an XML file. Since this is a pretty standard task in Python, I do not want to discuss this function here further. It should be sufficient to know, that it is reading the list of server IPs and additional runtime parameters (username, password, monitoring intervall, …) into a Python directory that is used in the subsequent parts of the script. I want to focus on the other three functions that are more specific to the ILO Prometheus exporter.
get_server_urls
The get_server_urls routine uses the list of ILO IP addresses to gather the correct URLs out of the Redfish resource directory. If the ILO is alive a Redfish client object for this ILO is created and the Redfish resource directory is read. The client object is stored together with the URLs for the thermal, power and computer system information in the python directory server_urls, which is the return value of the routine.
def get_server_urls( login_account, login_password, server, lfile):

    server_urls={}
    if LINUX:
        cmd='ping -c 2 '
    log=logopen(lfile)
    logwriter(log,'get_server_urls')
    for s in server:
        ilo_url="https://"+s['ilo']
        s["url"]=ilo_url
        if LINUX:
            response=os.system(cmd+s['ilo'])   # works on Linux without root priviliges
        else:
            response = ping(address=s['ilo'],count=1)  # requires root priviliges on Linux
            if(response.is_alive):
                response = 0
            else:
                response = 256
        if (response == 0):
            try:
                # Create a Redfish client object
                REDFISHOBJ = redfish.redfish_client(base_url=ilo_url, username=login_account, password=login_password)
                # Login with the Redfish client
                REDFISHOBJ.login()
                s["redfish"]=REDFISHOBJ
                resource_instances = get_resource_directory(REDFISHOBJ, lfile)
                for instance in resource_instances:
                    if '#ComputerSystem.' in instance ['@odata.type']:
                        s["ComputerSystem"]=instance['@odata.id']
                    if '#Power.' in instance ['@odata.type']:
                        s["Power"]=instance['@odata.id']
                    if '#Thermal.' in instance ['@odata.type']:
                        s["Thermal"]=instance['@odata.id']
                if len(s) > 4:
                    server_urls[s['ilo']]=s
                    logwriter(log,s['ilo']+' completed')
            except Exception as ex:
                logwriter(log,'Exception - get_server_urls: '+s['ilo'])
                logwriter(log,str(ex.__context__))
                if len(s) > 4:
                    server_urls[s['ilo']]=s
                pass
        else:
            logwriter(log,'Exception - ILO is not reachable: '+s['ilo'])
    logclose(log)
    return server_urls
get_server_data
The get_server_data routine takes the obtained server_urls of one of the monitored servers together with the Prometheus user information to retrieve the power and thermal data as well as some general system information data. The captured data is packed into a server_data directory and returned to the main program.
def get_server_data( login_account, login_password, server, lfile):

    server_data={}
    try:
        REDFISHOBJ = server["redfish"]
        # System Data
        server_data['System'] = REDFISHOBJ.get(server["ComputerSystem"]).obj
        # Power Data
        uri = REDFISHOBJ.get(server["Power"]).obj.Oem.Hpe['Links']['PowerMeter']['@odata.id']
        server_data["PowerMeter"] = REDFISHOBJ.get(uri).obj
        # Temperatures
        server_data['Temperatures'] = REDFISHOBJ.get(server["Thermal"]).obj["Temperatures"]
        return server_data;

    except Exception as ex:
        sys.stderr.write("ERROR during get_server_date: "+server["url"])
        if ex.status == 401:
            REDFISHOBJ = redfish.redfish_client(base_url=server["url"], username=login_account, password=login_password)
            REDFISHOBJ.login()
            server["redfish"] = REDFISHOBJ
        log=logopen(lfile)
        logwriter(log,'Exception')
        logwriter(log,str(ex.__context__))
        logclose(log)
        pass
display_results
The display_results routine takes the server_data retrieved by the get_server_data routine and puts it into the corresponding Prometheus node gauges.
def display_results( node, inode, server_metrics, server):
    hostname = (server_metrics['System']['HostName']).split('.')[0].replace('-','_')
    cn = server['ilo']
    inode.labels(cn).info({"Model":server_metrics['System']["Model"],"Manufacturer":server_metrics['System']["Manufacturer"],"SerialNumber":server_metrics['System']["SerialNumber"],"Hostname":hostname})
    node.labels(cn,server['Rack'],'Power','State').set(power_state[server_metrics['System']["PowerState"]])
    node.labels(cn,server['Rack'],'Power','Average').set(server_metrics["PowerMeter"]['Average'])
    node.labels(cn,server['Rack'],'Power','Maximum').set(server_metrics["PowerMeter"]['Maximum'])
    node.labels(cn,server['Rack'],'Power','Minimum').set(server_metrics["PowerMeter"]['Minimum'])
    for temperature in server_metrics['Temperatures']:
        if temperature['Status']['State'] == 'Enabled':
            node.labels(cn,server['Rack'],'Temperature',temperature["Name"]).set(temperature['ReadingCelsius'])
    return 0
The most current and complete HPE ILO Prometheus exporter (iloPromConnector.v4.3.py at the time of writing this blog), together with a routine (createILOcreadentials.v1.0.py) to generate XML-input file with encrypted user credentials, is available on Github.
Visualize the data
The CTC monitoring environment uses Prometheus as a time series database to store and Grafana to visualize the gathered data. Prometheus, Grafana, the HPE Storage Array Exporter for Prometheus and the HPE SimpliVity Exporter are deployed as Kubernetes pods in order to easily scale and adjust the CTC monitoring environment.
In order to insert the CTC power and temperature monitoring into this environment, I first had to containerize the HPE Server Exporter. I based the container on Ubuntu Linux, added Python and the necessary Python libraries to it and stored the server exporter script in the directory /opt/prometheus:
# User Ubuntu as the base Image
FROM ubuntu
#
LABEL maintainer="Thomas Beha"
LABEL version="4.3"
LABEL copyright="Thomas Beha, 2023"
LABEL license="GNU General Public License v3"
LABEL DESCRIPTION="CTC ILO Redfish Prometheus Connector Python container based on Ubuntu"
#
RUN apt-get update
RUN apt-get -y install python3.6 && \
    apt-get -y install python3-pip  && \
    apt-get -y install iputils-ping
RUN /usr/bin/pip3 install requests && \
    /usr/bin/pip3 install fernet && \
    /usr/bin/pip3 install cryptography && \
    /usr/bin/pip3 install lxml && \
    /usr/bin/pip3 install redfish && \
    /usr/bin/pip3 install prometheus_client
# copy the necessary python files to the container
RUN mkdir /opt/prometheus
COPY ./iloPromConnector.v4.3.py /opt/prometheus
I used this Dockerfile to generate a container image and uploaded it into my registry. Before I could define the Kubernetes pod based on this container image, I had to decide how to provide the input data to the pod. The current HPE server exporter expects to have the input data available at /opt/prometheus/data. The easiest and most flexible way to provide the input data is to use a Kubernetes config map. This allowed me to use the same container image multiple times, each time with a different config map. The large number of servers hosted in the CTC required multiple server exporter, each one with a different list of server to monitor. An example of a config map that I used is shown below:
apiVersion: v1
kind: ConfigMap
metadata:
  name: iloprom1-xml
  namespace: svtprometheus
data:
  iloprometheus.key: |-
    LVkjkV5j40Fl6U0O7ratU0RDf5W1NmAE0oqoQ2DaE74=
  iloprometheus.xml: |-
    <data>
      <username>Prometheus</username>
      <user>gAAAAABig6ZJgST83R7v5AFjsOKiYt0bdledJpF3-TnUBR5871eNttG8P-O_eYA55-5NyyZgmmeWRnWy3hPAbUFk18_sWNw==</user>
      <password>gAAAAABig6ZJAZL8wS41b0snZ76VWo17JysUq0-k5NUCU1y5AAPw5p1MphkFcB_u6z0TgcPbmR9yJcX39Cx0Egwv5Lou8A==</password>
      <monitoringintervall>30</monitoringintervall>
      <logfile>iloprometheus.log</logfile>
      <port>9091</port>
      <server> <ILO_ip>10.1.40.5</ILO_ip>,<Rack>i5</Rack>,<Loc>16</Loc> </server>
      <server> <ILO_ip>10.1.40.6</ILO_ip>,<Rack>i5</Rack>,<Loc>14</Loc> </server>
      <server> <ILO_ip>10.1.40.7</ILO_ip>,<Rack>i5</Rack>,<Loc>19</Loc> </server>
      <server> <ILO_ip>10.1.40.8</ILO_ip>,<Rack>i5</Rack>,<Loc>18</Loc> </server>
      <server> <ILO_ip>10.0.44.11</ILO_ip>,<Rack>F12</Rack>,<Loc>24</Loc> </server>
      <server> <ILO_ip>10.0.44.12</ILO_ip>,<Rack>F12</Rack>,<Loc>22</Loc> </server>
      <server> <ILO_ip>10.0.44.13</ILO_ip>,<Rack>F12</Rack>,<Loc>20</Loc> </server>
      <server> <ILO_ip>10.1.24.66</ILO_ip>,<Rack>C5</Rack>,<Loc>30</Loc> </server>
      <server> <ILO_ip>10.0.43.14</ILO_ip>,<Rack>i12</Rack>,<Loc>9</Loc> </server>
    </data>
As you can see, the config map contains two data parts: the iloprometheus.key and the iloprometheus.xml section. The first one stores the encryption key, while the second one stores username and password encrypted with the encryption key iloprometheus.key, the monitoring intervall, the logfile name and the port used by the exporter together with the server data. I used the rack location, in addition to the ILO IP address, in order to be able to visualize a rack temperature diagram if needed.
The config map was stored in a YAML-file (iloprom1.yml) and then applied in my Kubernetes environment:
kubectl apply -f iloprom1.yml
With the config map in place, I was able to define the Kubernetes pod for the HPE Server exporter. The pod uses the iloprometheus:v4.3.1 container image, mounts the config map data to the /opt/prometheus/data directory in the container and starts the Python script /opt/prometheus/iloPromConnector.v4.3.py.
cat << 'EOF' | kubectl apply -f -
apiVersion: apps/v1
kind: Deployment
metadata:
  name: ilo1
  namespace: svtprometheus

  labels:
    app: ilo1
spec:
  selector:
    matchLabels:
      app: ilo1
  template:
    metadata:
      labels:
        app: ilo1
    spec:
      containers:
        - name: ilo1
          image: tb1378/iloprometheus:v4.3.1
          command: ["/usr/bin/python3"]
          args: ["/opt/prometheus/iloPromConnector.v4.3.py"]
          volumeMounts:
            - name: iloprometheusxml
              mountPath: /opt/prometheus/data
      volumes:
        - name: iloprometheusxml
          configMap:
            name: iloprom1-xml   # the correct name of the configmap needs to be added here.
EOF
After I checked that the pod was up and running, I found that I still needed to define the Kubernetes service using this pod/app in order to have the exporter data available for Prometheus.
cat << 'EOF' | kubectl apply -f -
apiVersion: v1
kind: Service
metadata:
  name: ilo1
  namespace: svtprometheus
#  labels:
#     hpecp.hpe.com/hpecp-internal-gateway: "true"
spec:
  selector:
    app: ilo1
  ports:
    - port: 9091               # The Port of that the Prometheus connector uses
      targetPort: 9091
      protocol: TCP
  type: NodePort               # expose the Prometheus connector if you want/need to debug it.
EOF
Next, I updated the Prometheus config map to make sure that the server exporter data was collected and stored in the Prometheus time series database. Hence, I added a job for the server exporter to the existing job list of the Prometheus config map:
    - job_name: 'iloredfish'
      static_configs:
      - targets: ['ilo1:9091','ilo2:9091','ilo3:9091','ilo4:9091','ilo5:9091','ilo6:9091']
      honor_timestamps: true
      scrape_interval: 60s
      scrape_timeout: 20s
      metrics_path: /metrics
      scheme: http
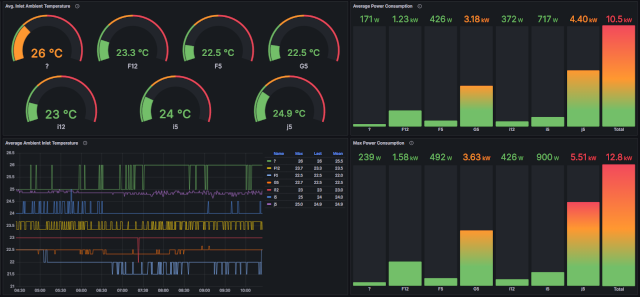
As you can see from the above, I actually used six server exporter (ilo1 up to ilo6) in the CTC monitoring environment to cover the complete list of server hosted in the CTC. After having the data collected into the Prometheus timeseries database, I defined some Grafana dashboards to visualize the collected data. I don't want to get into the details of defining Grafana dashboards here - this is well documented in the Grafana documentation. I just want to give you an example of a dashboard I have used:
Conclusion
In this blog post, I documented my approach on solving a challenge we had in the Customer Technology Center Böblingen by using available API interfaces and building on an existing Kubernetes, Prometheus and Grafana environment. I decided to write this rather long blog in order to give you all necessary steps I did in detail with the goal to show you what can be done with public APIs, a little bit of Python scripting and the use of open source tools like Prometheus and Grafana. I do hope that this is helpful when you need to develop your own data collectors.
The complete Python script together with sample Grafana dashboards and a Jupyter notebook for the deployment as a Kubernetes service is available at https://github.com/tbeha/iloPrometheus.
Check out what the Customer Technology Center in Boeblingen looks like here.
Related
Leveraging HPE OneView Single Sign On to iLO Management Processors
Sep 11, 2017
Benefits of the Platform Level Data Model for Firmware Update Standard
Jun 7, 2022
Build your own iLO Redfish simulator
Jun 11, 2021
Discover the power of data center monitoring using Redfish telemetry and cloud-native tooling: Part 2 - Streaming
Dec 1, 2023
Discover the power of data center monitoring using Redfish telemetry and cloud-native tooling
Oct 5, 2023
How to change the factory generated iLO Administrator password
Mar 29, 2018