

Get started with Prometheus and Grafana on Docker with HPE Storage Array Exporter
January 26, 2022With the recently released HPE Storage Array Exporter for Prometheus and HPE CSI Info Metrics Provider for Prometheus, it's a good time to familiarize ourselves with the cloud native technologies involved and get some first-hand experience.
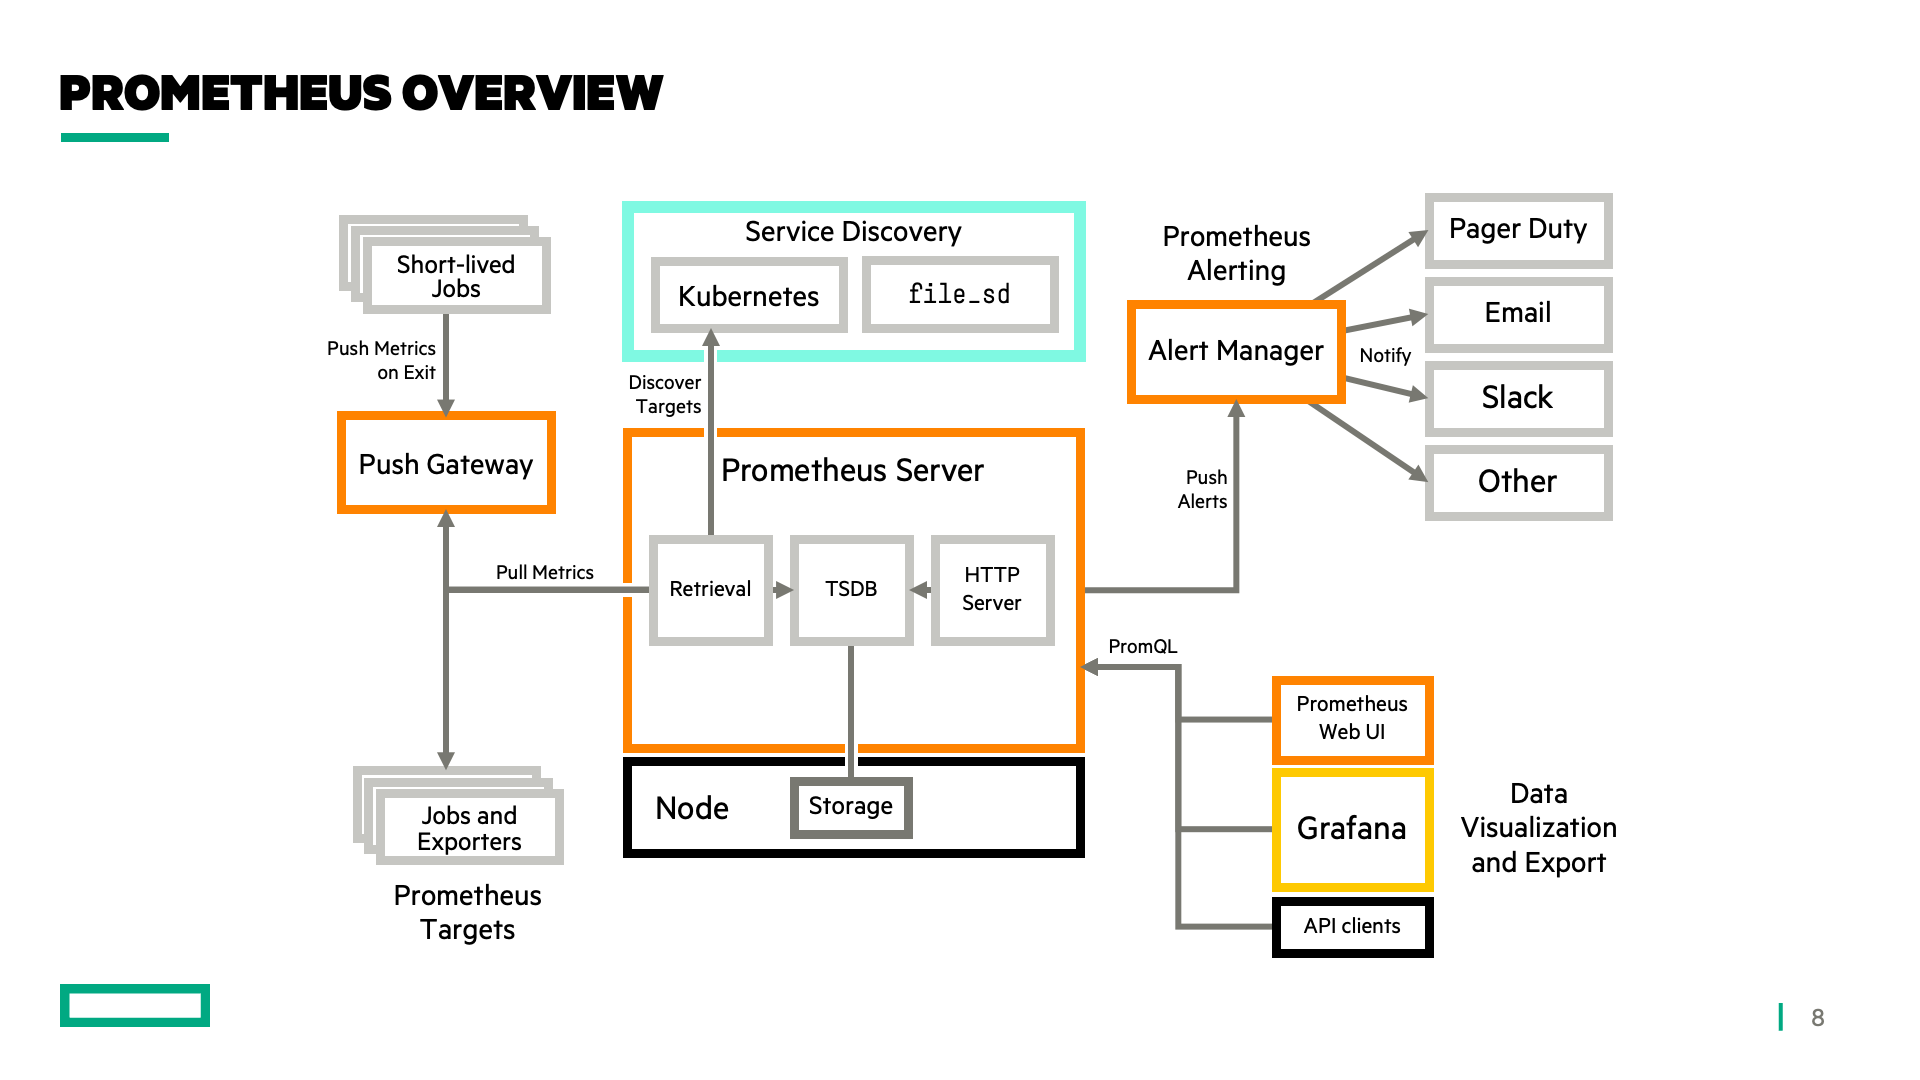
Prometheus is a time-series database that also provides monitoring and alerting. It's a CNCF graduated project. Grafana is a web-based visualization tool that uses time-series data to create beautiful graphs and elements to present data in views referred to as dashboards. Prometheus scrapes an HTTP endpoint of a target periodically to consume an assortment of metric types and and metadata. The target is usually referred to as an exporter and the data being scraped is the current state of one or many exporter data points.
In this tutorial we'll learn how to deploy Prometheus, Grafana and the HPE Storage Array Exporter for Prometheus using nothing but Docker. A supported storage backend, such as a HPE Alletra, Nimble Storage, Primera or 3PAR is needed to gather metrics for visualization. These prerequisites are assumed along with basic Docker and container knowledge. While this is a highly opinionated tutorial, the different components may be run standalone on Windows or Linux and may also be deployed directly on Kubernetes with Helm.
Note: This tutorial is purely for educational purposes and not intended for production deployments.
Get started
This tutorial assumes Docker is installed and functional. Credentials are also needed for a backend system. HPE Nimble Storage is being used in the examples and metrics may be named differently when using something else. Still, the principles remain the same.
To allow the containers to communicate with each other by name, a separate bridge network is created.
docker network create prometheus
Note that all containers created below do not utilize any persistent storage at all. Any dashboards that have been created or metrics that have been gathered will not be accessible after a container restart.
Run HPE Storage Array Exporter for Prometheus
Let's begin by starting the HPE Storage Array Exporter for Prometheus container. It's a passive background process that responds to HTTP requests made by Prometheus. It also requires a backend configuration file. In the case of having multiple backends, one container and configuration file is needed for each one.
Create a file named my-array-1.yaml:
address: my-array-1
username: admin
password: admin
The address value can be an IP address or hostname resolvable in DNS. Then, run docker:
docker run -d --rm --name my-array-1 \
     -v $(pwd)/my-array-1.yaml:/etc/config/storage-system.yaml \
     --network prometheus \
     quay.io/hpestorage/array-exporter:v1.0.0 \
     --log.path /var/log/hpe-array-exporter.log \
     --accept-eula \
     /etc/config/storage-system.yaml
By running the above command with the --accept-eula parameter, the end-user accepts the HPE End User License Agreement at https://www.hpe.com/us/en/software/licensing.html.
The exporter is now up and running listening on port 8080. To ensure we can reach the metrics endpoint, run the following docker command:
docker run --rm --network prometheus \
    curlimages/curl -s http://my-array-1:8080/metrics
It should produce an output that enumerates the metric keys, value, type and brief help. An example:
# HELP hpenimble_pool_snapshot_used_bytes Total logical size of all snapshots in a storage pool
# TYPE hpenimble_pool_snapshot_used_bytes gauge
hpenimble_pool_snapshot_used_bytes{pool="default"} 2.659803136e+09
Next, let's start Prometheus and scrape some metrics.
Run and Inspect Prometheus
When Prometheus is deployed on Kubernetes, discovery of scrape targets may be configured to be performed dynamically. In this example we need to instruct Prometheus where to find our target. Create a configuration file named prometheus.yml:
global:
  scrape_interval: 15s
  evaluation_interval: 15s

scrape_configs:
  - job_name: "my-array-1"
    static_configs:
      - targets: ["my-array-1:8080"]
Create the Prometheus container:
docker run -d --rm --name prometheus-server \
    --network prometheus \
    -p 80:9090 \
    -v $(pwd)/prometheus.yml:/etc/prometheus/prometheus.yml \
    prom/prometheus:v2.30.3
In a few moments, the Prometheus server should be up and listening on the Docker host and accessible from http://your.docker.host.example.com/ or http://localhost.
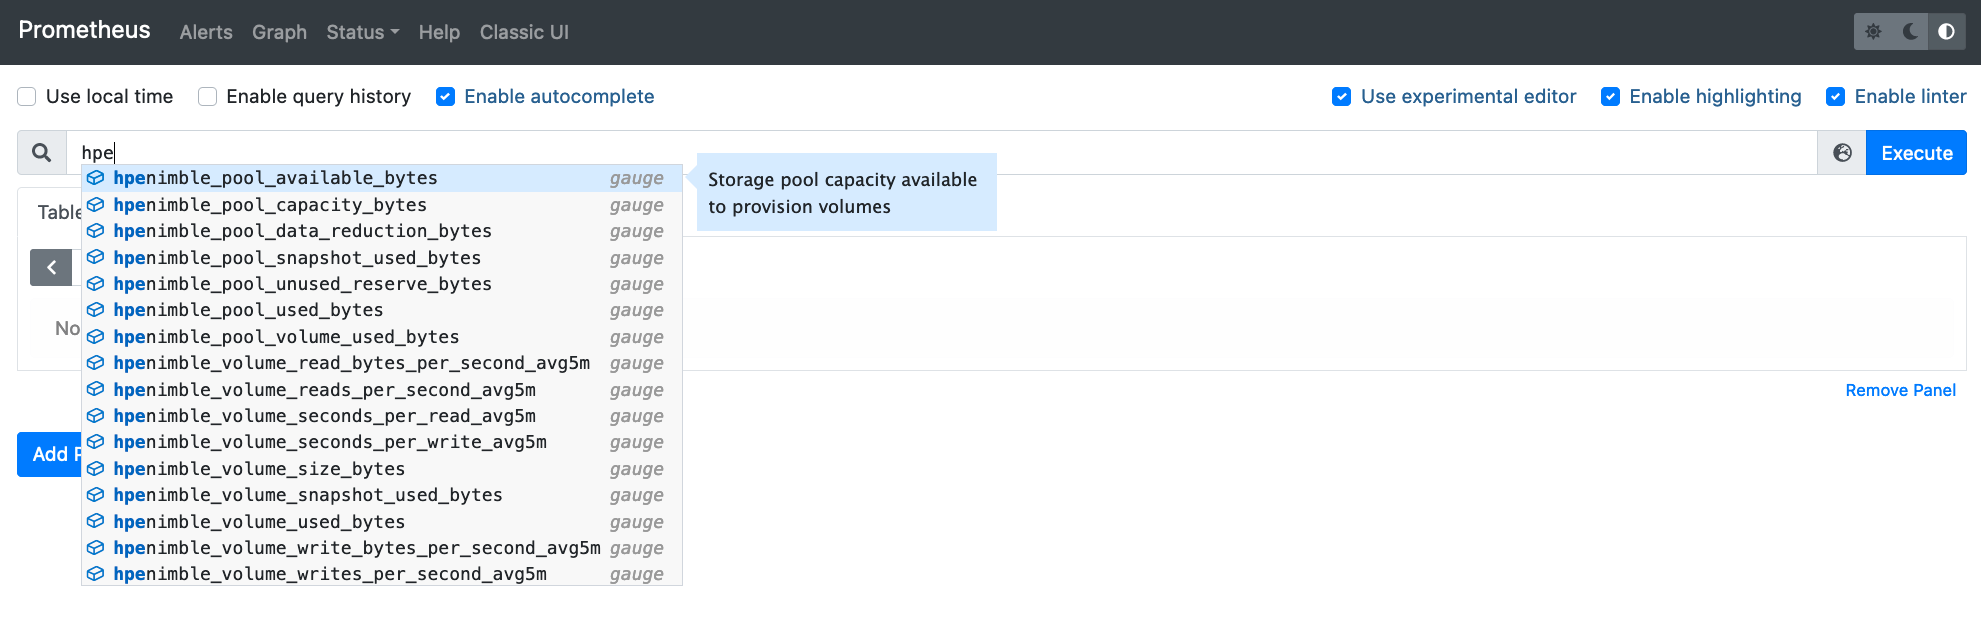
To inspect if metrics are being collected properly, access the web interface and start typing hpe in the query bar.
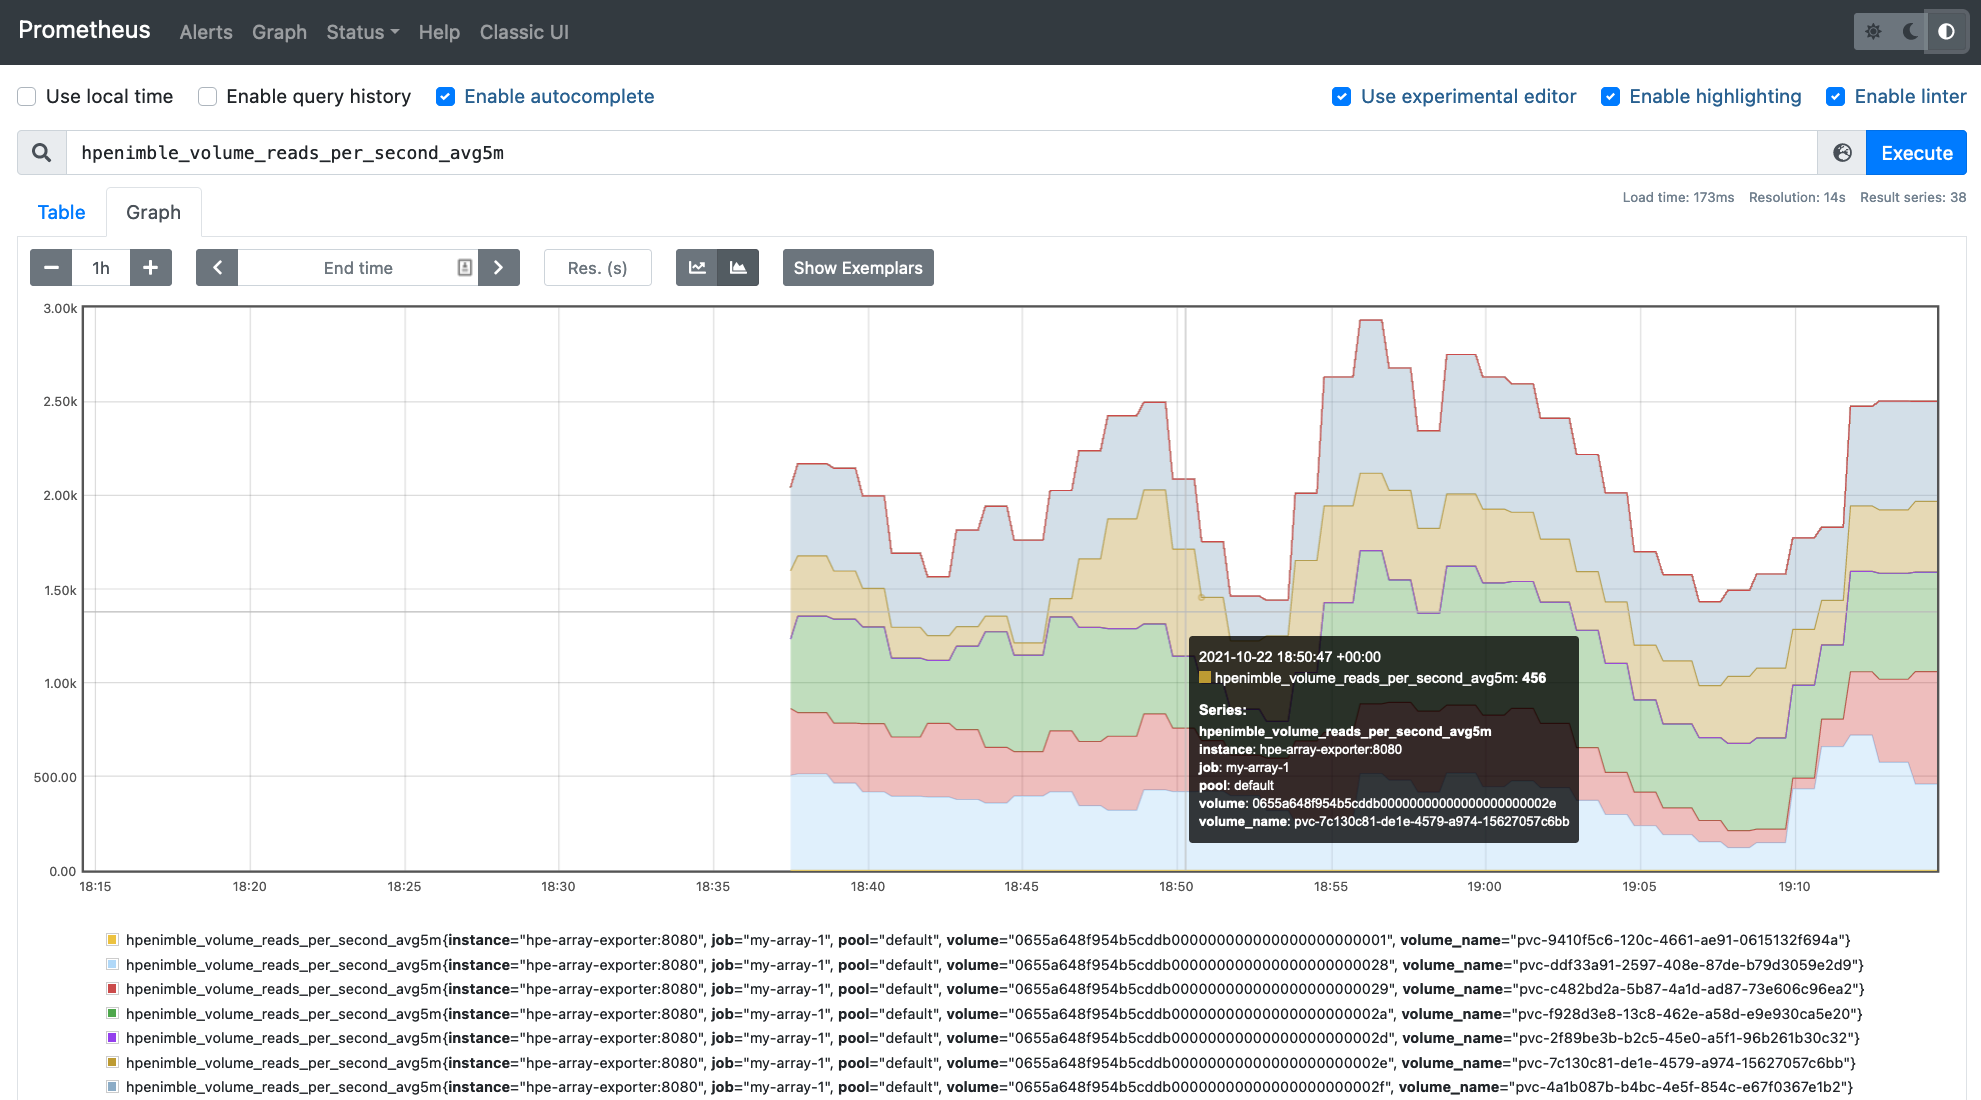
Select a volume_reads_per_second metric, hit Execute and click Graph. This should produce a filled line graph with all the volumes on the array and their read IOPS. Wait a few minutes if there's no data being presented.
Next, we'll bolt on Grafana and connect to the Prometheus data source.
Run Grafana and Build Your First Dashboard
In this tutorial, we'll just use the built-in dashboards and plugins that come with Grafana. Accessing Grafana is mainly done through the intuitive web UI found on port 3000. Let's start it up:
docker run --rm -d --name grafana \
    --network prometheus \
    -p 3000:3000 \
    grafana/grafana:8.2.2
Next, navigate to the web UI (http://your.docker.host.example.com:3000/ or http://localhost:3000) and log in with user "admin" and password "admin". You'll be prompted to create a new password.
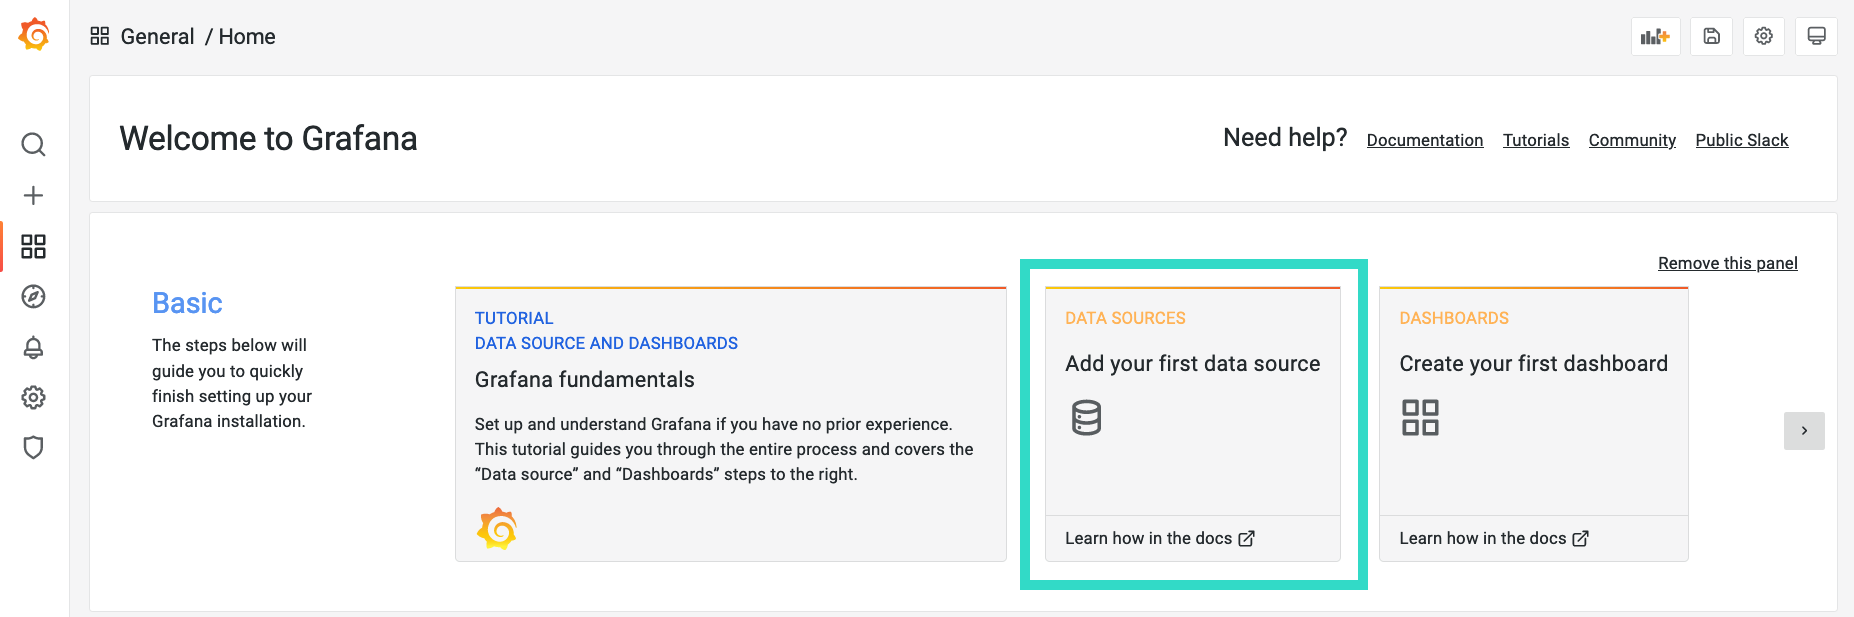
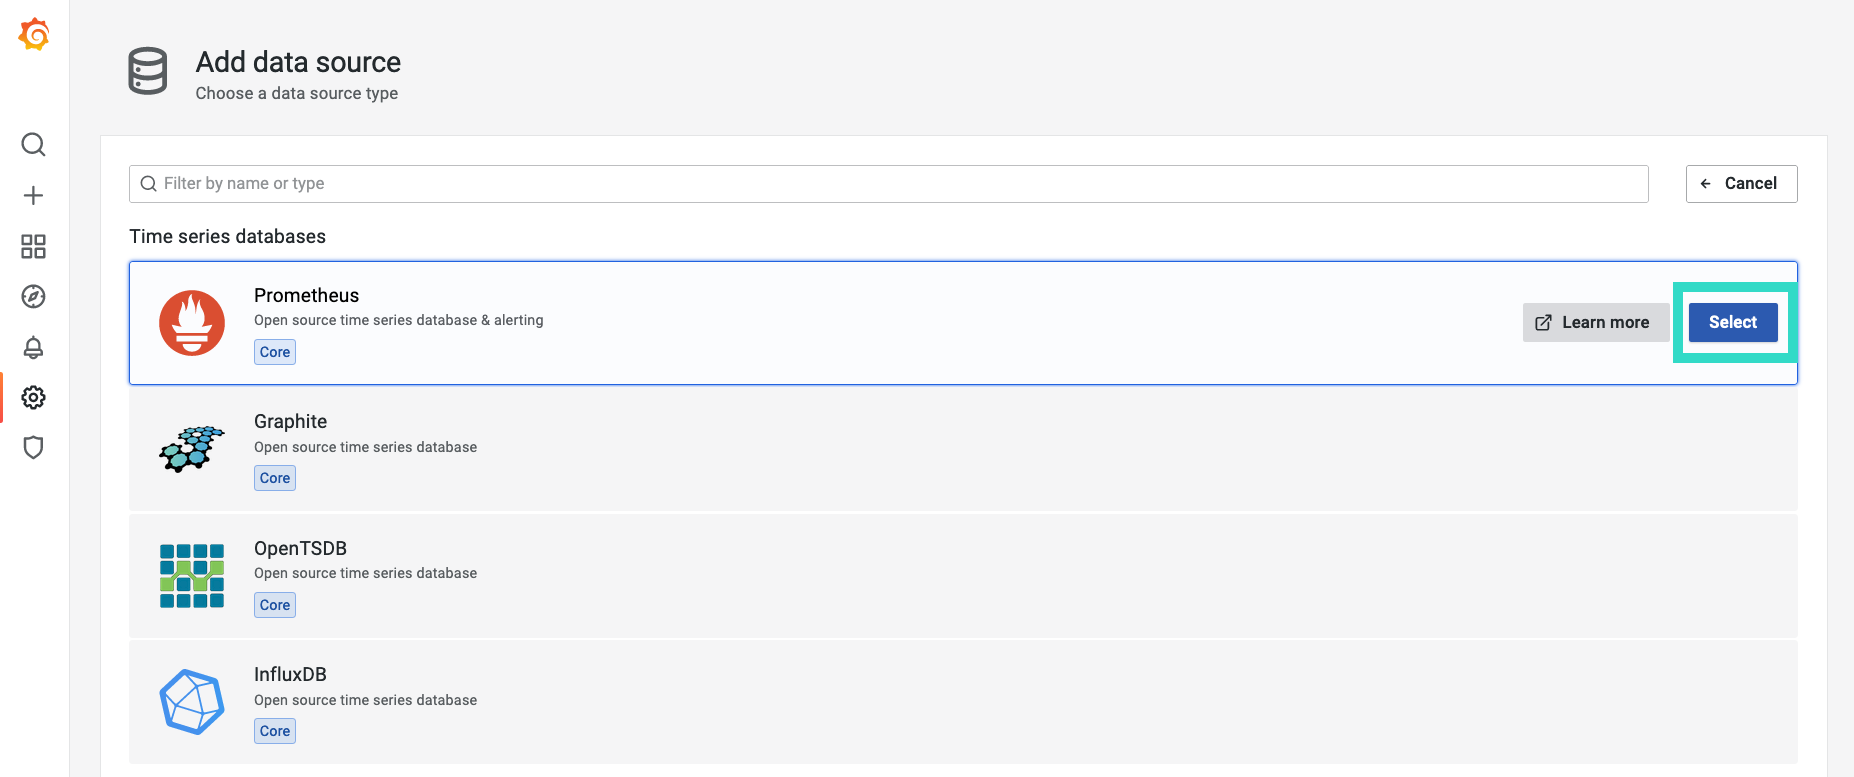
Now, a data source needs to be added. A panel to do so is available on the main screen.
Next, select "Prometheus".
In the HTTP section of the configuration, enter http://prometheus-server:9090. Click Save & test at the bottom of the page. A green checkmark should be displayed and indicate that the data source is working.
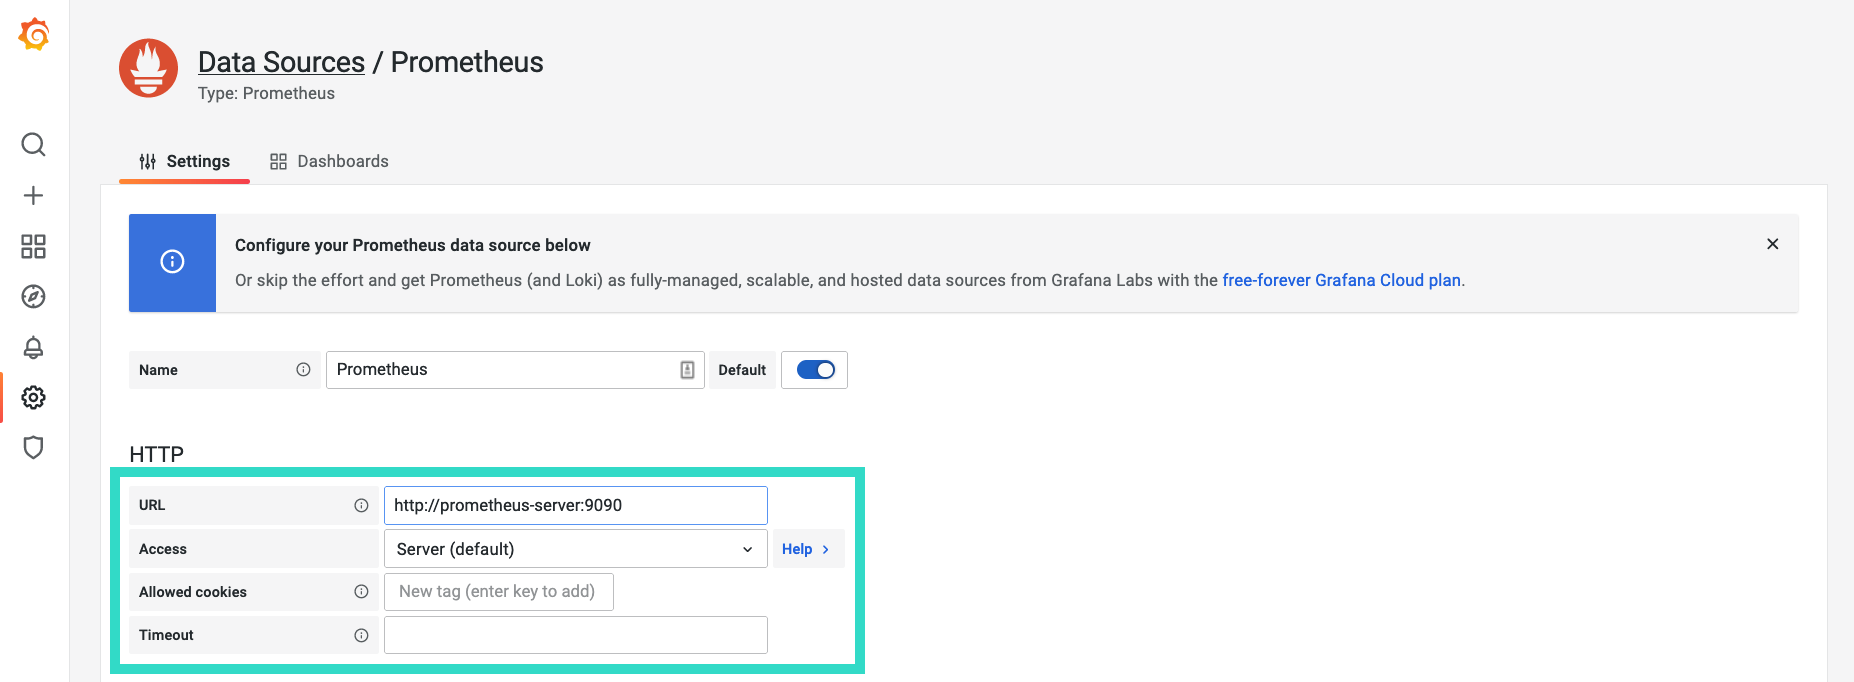
At this point, Grafana is able to retrieve data series from Prometheus and dashboards may now be created.
Hit the big + sign on the right, click Dashboards and Add an empty panel.
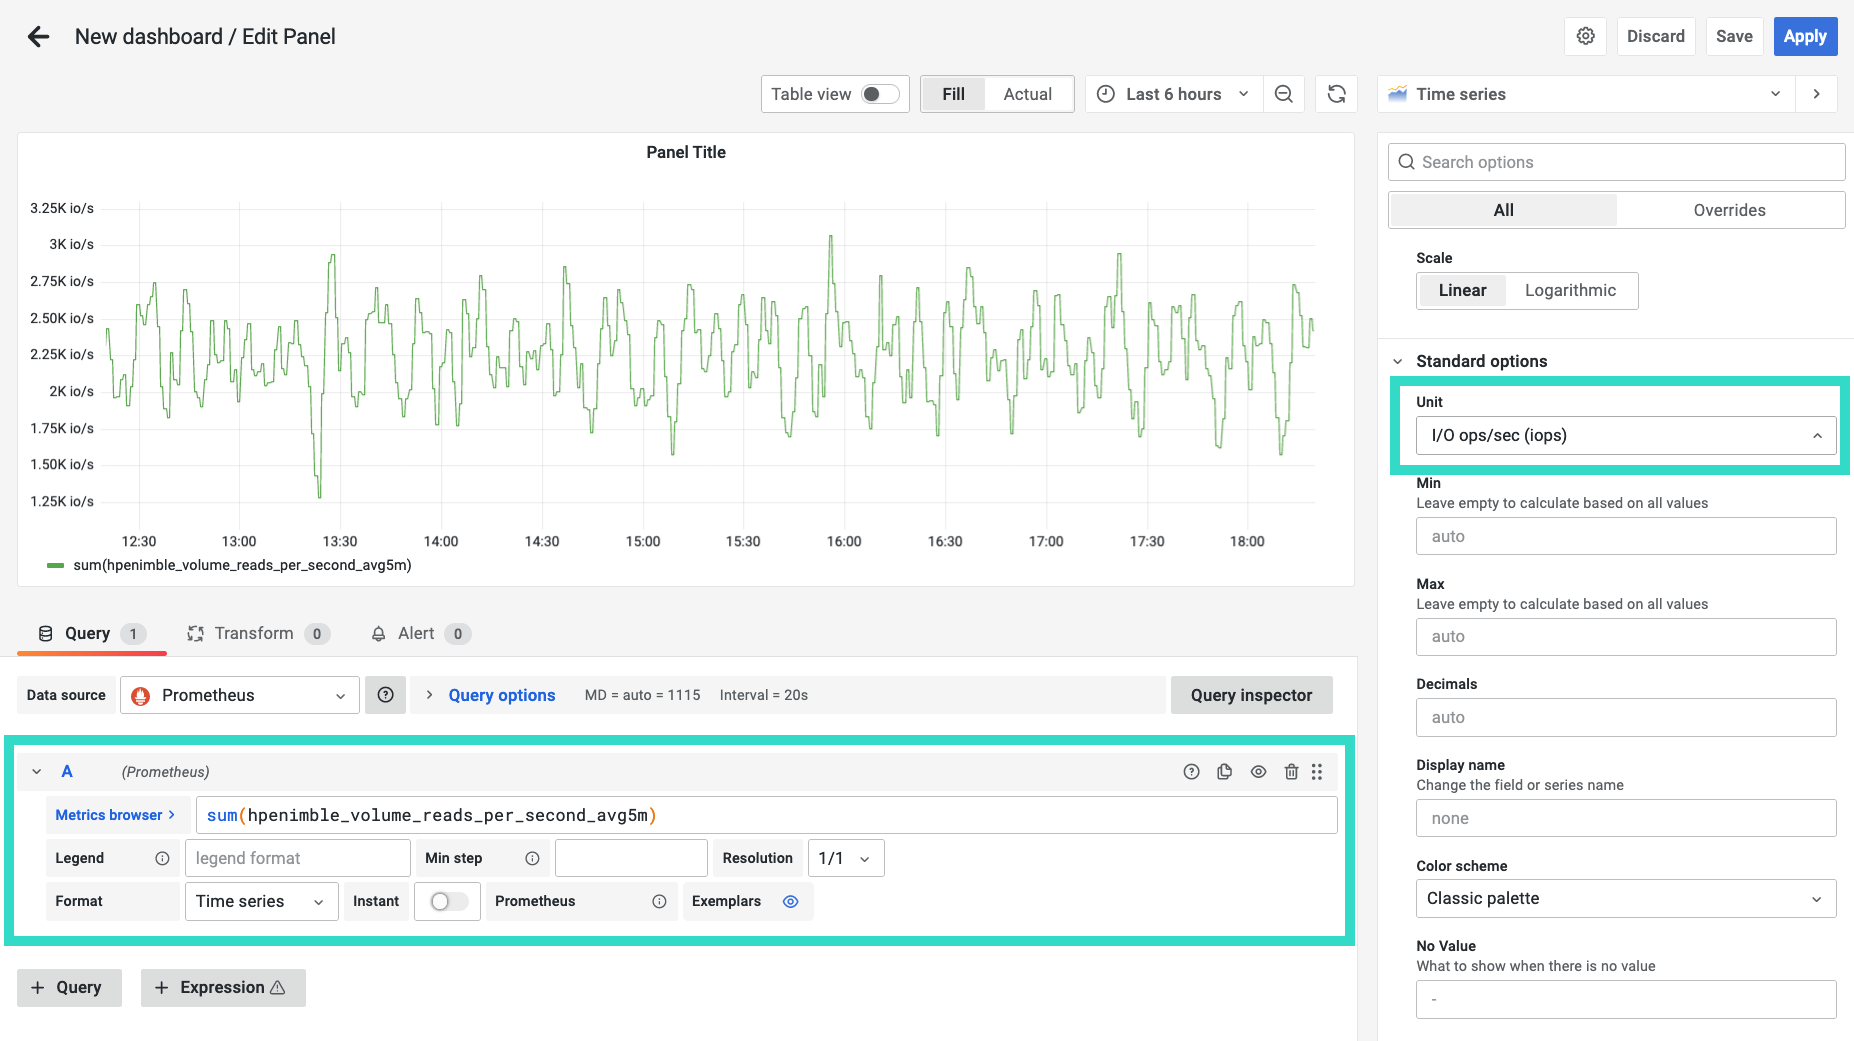
Creating a graph involves adding a query from the data source. The field uses auto-complete, so start typing hpe and the field will populate. In the example below, a simple sum operation is performed on the hpenimble_volume_reads_per_second_avg5m metric which produces a combined read IOPS performance graph. The axis itself has been customized to show io/s.
This concludes this introductory tutorial. Next, the possibilities are endless. Use cases include full stack monitoring of applications and the underlying infrastructure. Setting up thresholds for alarms with different outputs, such as email or Slack. Project growth trends for both capacity and performance for your storage estate. Please find additional resources below on how to learn more about Prometheus, Grafana and the HPE Storage Array Exporter for Prometheus.
Where to go next?
I've only touched the tip of the iceberg in this tutorial to inspire deeper learning. Both Prometheus and Grafana are rich ecosystems that require their own exploration to better understand the fundamentals.
It's also important to highlight again that this does not reflect a production deployment. It's more common to deploy and manage Prometheus on Kubernetes. The same patterns also apply for Grafana. The HPE Storage Array Exporter for Kubernetes may also be deployed on Kubernetes along with the HPE CSI Info Metrics Provider for Prometheus (Container Storage Interface) to give a holistic view of stateful workloads utilizing persistent storage from any of the supported HPE storage backends.
- Introduction to Prometheus
- Get started with Grafana
- Learn more about HPE Storage Array Exporter for Prometheus
- Deploy HPE CSI Info Metrics Provider for Prometheus with the HPE CSI Driver for Kubernetes
- Explore the preconfigured HPE Storage dashboards on grafana.com.
Watch this space for future updates on monitoring and alerting for HPE Storage using the aforementioned technologies. Don't forget that you can reach the team on the HPE DEV Slack. Sign up here and log in at https://hpedev.slack.com.
Related

Getting started with the HPE Data Services Cloud Console Powershell SDK
Aug 7, 2023
Host-based Volume Encryption with HPE CSI Driver for Kubernetes
Jun 15, 2021Lift and Transform Apps with HPE CSI Driver for Kubernetes
Jun 17, 2022Multitenancy for Kubernetes clusters using HPE Alletra 6000 and Nimble Storage
Jun 15, 2021