Observe any observable using HPE OpsRamp — Part 3: Testing the stack with otel-cli and promtool
May 4, 2026Part 3 of a series on vendor-neutral observability with HPE OpsRamp and OpenTelemetry
Introduction
In Part 2, I built and verified the local observability stack — five containers running cleanly with health checks passing. But verifying that a component is healthy is not the same as verifying that it behaves correctly under realistic signal loads. Before connecting HPE OpsRamp and writing any Python instrumentation code, I want to test every part of the pipeline using purpose-built command-line tools.
In this article I introduce two tools that belong in every observability engineer's toolkit: otel-cli for injecting OpenTelemetry (OTel) signals signals directly into the Collector without writing application code, and promtool for validating Prometheus configuration and running PromQL queries against live data. Used together, they let me test the entire signal pipeline — from emission to storage to query — before a single line of agent code runs.
Both tools run as Docker containers in the same network as the stack, making them frictionless to add for testing and easy to remove when not required.
Adding the testing tools to Docker Compose
I add both tools to docker-compose.yml using Docker Compose profiles. A profile means the container is not started by default — it only runs when explicitly requested. This keeps the production stack clean while making the tools instantly available.
# Add to docker-compose.yml services section

  # otel-cli: Inject OTel spans, metrics, and logs directly via command line
  # Useful for testing the collector pipeline without application code
  # Reference: https://github.com/equinix-labs/otel-cli
  otel-cli:
    image: ghcr.io/equinix-labs/otel-cli:latest
    container_name: otel-cli
    environment:
      - OTEL_EXPORTER_OTLP_ENDPOINT=otel-collector:4317
      - OTEL_EXPORTER_OTLP_INSECURE=true
    networks:
      - redfish-poc
    profiles: ["tools"]   # not started automatically

  # promtool: Prometheus configuration checker and PromQL query runner
  # Useful for validating prometheus.yml and querying live Prometheus data
  # Reference: https://prometheus.io/docs/prometheus/latest/command-line/promtool/
  promtool:
    image: prom/prometheus:latest
    container_name: promtool
    entrypoint: /bin/promtool
    networks:
      - redfish-poc
    profiles: ["tools"]   # not started automatically
The profiles: ["tools"] declaration means docker compose up -d will never start these containers. They are invoked with docker compose run which starts them, runs the command, and exits.
Testing with otel-cli: Injecting signals without code
otel-cli is a command-line tool for generating OpenTelemetry signals — spans, metrics, and logs — directly from the shell. It uses the same OTLP protocol as any OTel SDK, so the signals it sends are indistinguishable from application-generated signals from the collector's perspective.
This makes it ideal for two testing purposes: confirming that the collector receives and routes signals correctly, and generating known test data for validating downstream systems like Jaeger.
Test 1: Send a test span and verify it appears in Jaeger
The simplest test is to send a trace span representing a simulated Redfish API poll and verify it appears in Jaeger.
# Send a single span simulating a Redfish chassis power poll
sudo docker compose run --rm otel-cli exec \
  --name "redfish.poll_cycle" \
  --service "opsramp-redfish-agent" \
  --attrs "chassis.id=Chassis-1,host.name=Chassis-1,type=RESOURCE" \
  -- echo "Simulated Redfish poll cycle"
Now open Jaeger at http://<EC2-IP>:16686, select service opsramp-redfish-agent, and click Find Traces. You should see a trace named redfish.poll_cycle with the attributes attached.
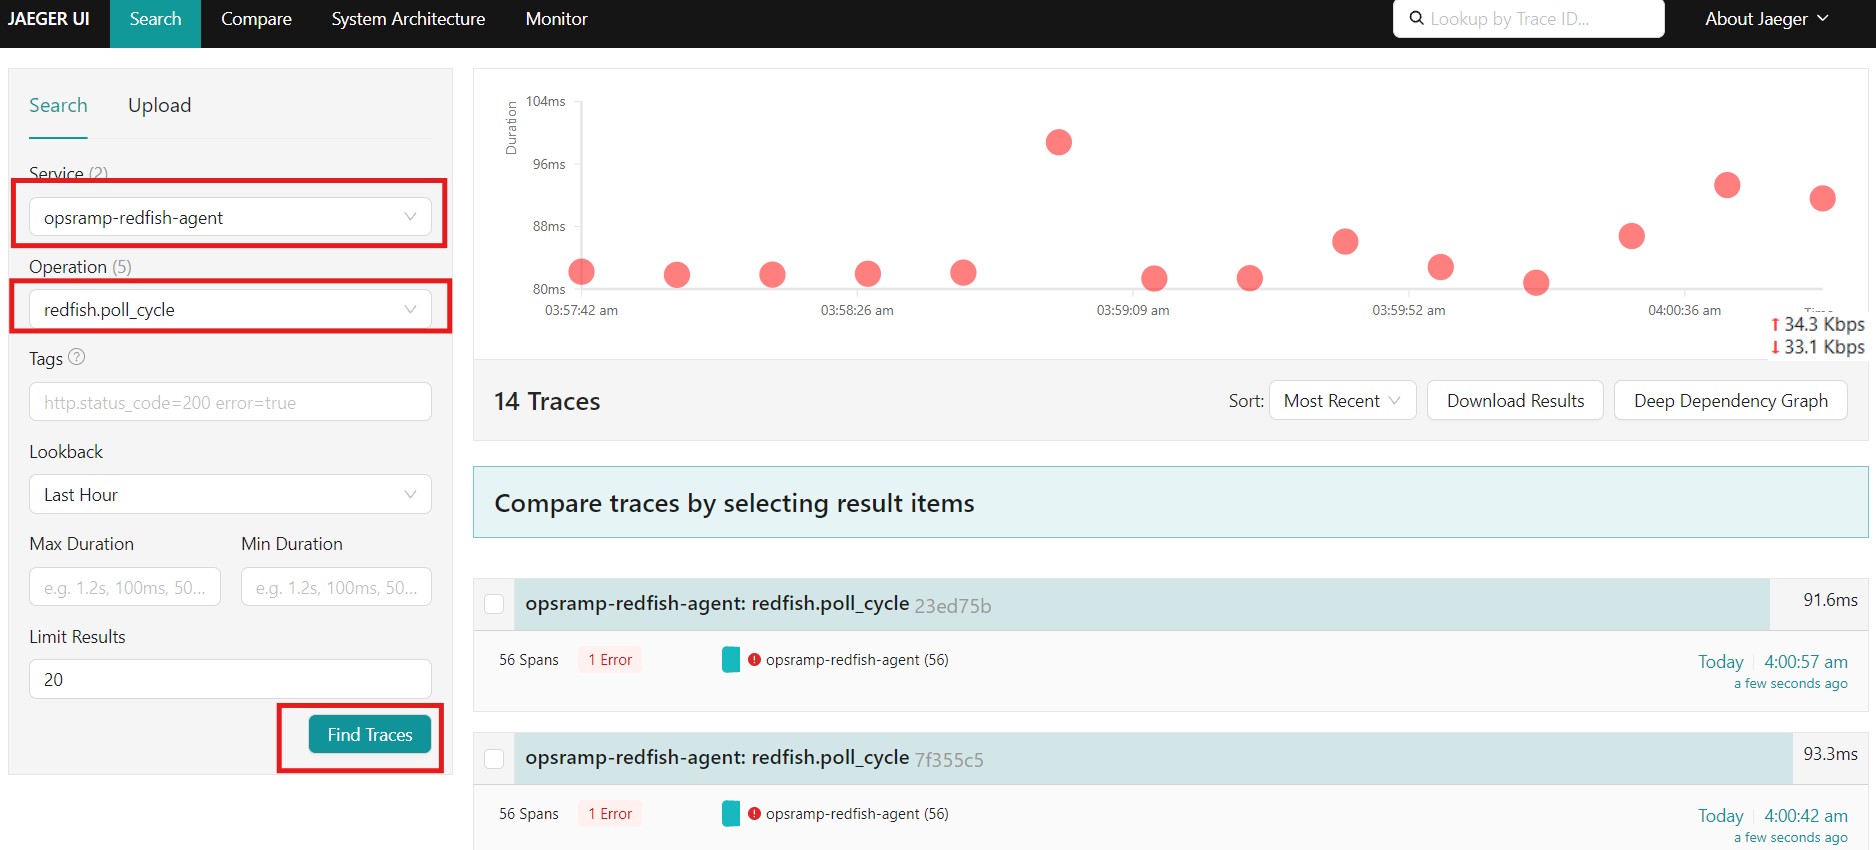
This confirms the entire trace path: otel-cli → OTLP/gRPC → collector traces pipeline → Jaeger.
Test 2: Send a nested trace simulating the full poll hierarchy
A more realistic test sends a parent span with child spans matching the actual agent's call pattern.
# Send parent span for the poll cycle
TRACEPARENT=$(sudo docker compose run --rm otel-cli \
  span \
  --service "opsramp-redfish-agent" \
  --name "redfish.poll_cycle" \
  --attrs "cycle.chassis_count=13,cycle.system_count=7,host.name=Redfish-Server,type=RESOURCE" \
  --print-tp \
  2>/dev/null)

echo "Traceparent: $TRACEPARENT"

# Send child spans for individual chassis polls
for chassis in Chassis-1 Chassis-2 Chassis-3; do
  sudo docker compose run --rm \
    -e TRACEPARENT="$TRACEPARENT" \
    otel-cli span \
    --service "opsramp-redfish-agent" \
    --name "poll.chassis" \
    --attrs "chassis.id=${chassis},host.name=${chassis},type=RESOURCE,power.consumed_watts=250.0"
done
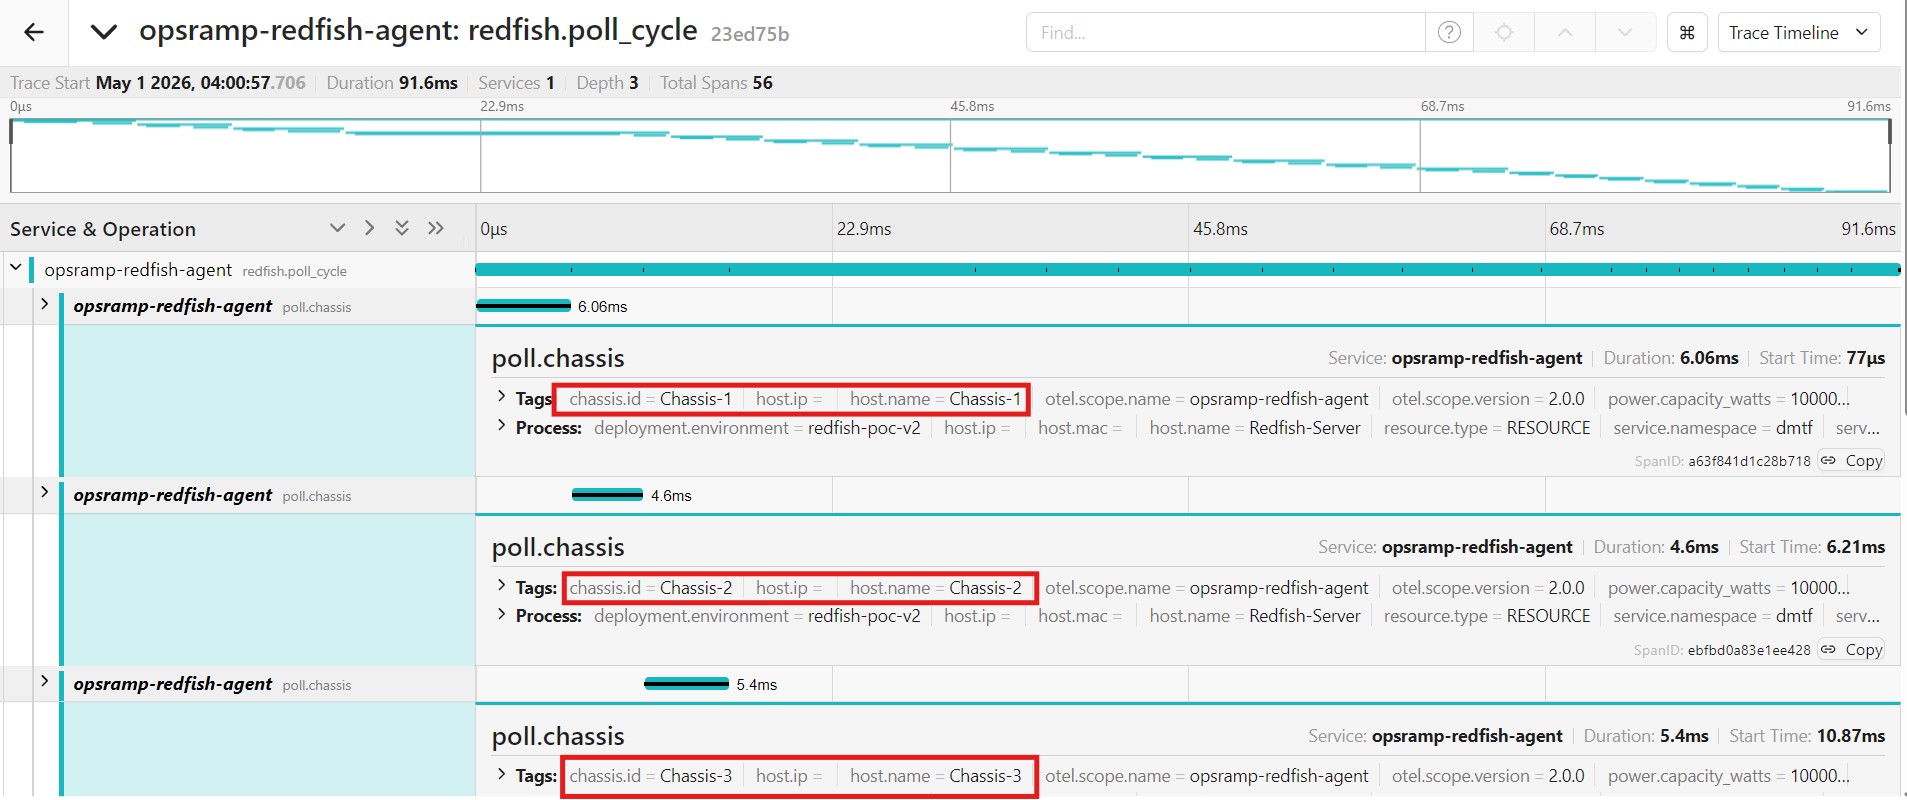
Open Jaeger and find the trace. You should see a waterfall with the parent redfish.poll_cycle span containing three child poll.chassis spans — exactly matching the structure the real agent produces.
Test 3: Send a test log record and verify it reaches the collector
# Send a log record simulating a Redfish hardware event
sudo docker compose run --rm otel-cli log \
  --service "opsramp-redfish-agent" \
  --severity "WARN" \
  --body "[REAL][Alert] Temperature above threshold on Chassis-1" \
  --attrs "host.name=Chassis-1,type=RESOURCE,redfish.event.severity=Warning,redfish.event.origin=/redfish/v1/Chassis/Chassis-1/Thermal"
Verify the log reached the collector:
sudo docker logs otel-collector 2>&1 | grep -i "temperature\|Chassis-1" | tail -5
Test 4: Verify the httpcheck receiver is producing metrics
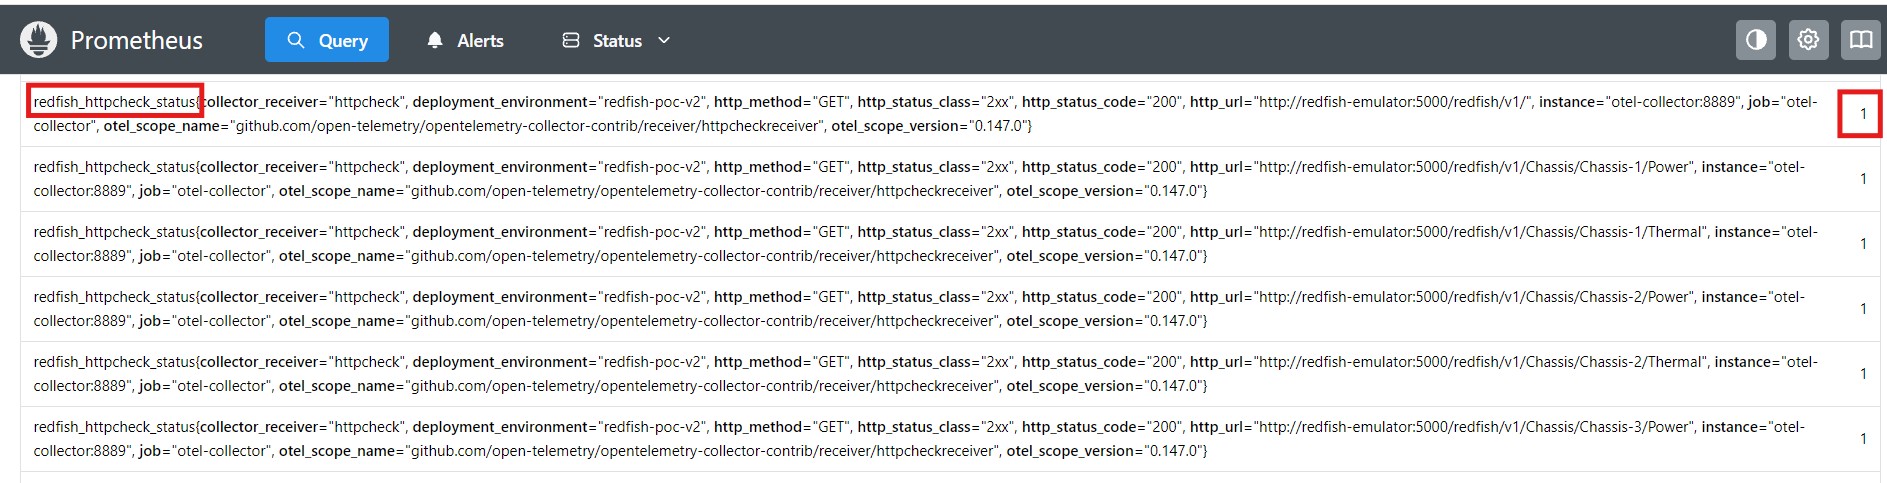
Without running the agent at all, the httpcheck receiver should already be producing metrics for every Redfish endpoint it polls.
# Check httpcheck metrics in Prometheus exporter
curl -s http://localhost:8889/metrics | \
  grep "redfish_httpcheck_status" | \
  python3 -c "
import sys
for line in sys.stdin:
    if 'http_url=' in line:
        url = line.split('http_url=\"')[1].split('\"')[0]
        val = line.strip().split()[-1]
        status = 'UP  ✓' if val == '1' else 'DOWN ✗'
        print(f'  {status}  {url}')
"
Expected: All Redfish endpoints showing UP ✓. If any show DOWN, check that the emulator container is healthy.
Test 5: Verify collector pipeline counts
After running the tests above, use the zpages API to confirm the collector counted the signals.
# Fetch pipeline stats in text form
curl -s http://localhost:55679/debug/pipelinez | \
  python3 -c "
import sys, re
content = sys.stdin.read()
# Find receiver/exporter counts
counts = re.findall(r'(receiver|exporter)[^\d]+(\d+)', content)
for kind, count in counts[:10]:
    print(f'  {kind}: {count}')
"
You should see non-zero counts for the receivers (spans/metrics/logs received) and exporters (forwarded to Prometheus, Jaeger, etc.).
Testing with promtool: Validating Prometheus configuration
promtool is the official Prometheus command-line utility. I use it for two purposes: validating the prometheus.yml before applying it, and running PromQL queries against live Prometheus data to confirm metrics are queryable.
Test 1: Validate prometheus.yml syntax
Always validate the configuration before restarting Prometheus.
# Validate configuration file
sudo docker compose run --rm promtool \
  check config /etc/prometheus/prometheus.yml \
  --config.file=/dev/stdin <<< "$(cat prometheus.yml)"
Or mount the file directly:
sudo docker compose run --rm \
  -v ~/sivabala/siva-sdk/poc-v2/prometheus.yml:/prometheus.yml:ro \
  promtool \
  check config /prometheus.yml
Expected output:
Checking /prometheus.yml
  SUCCESS: /prometheus.yml is valid prometheus config file syntax
Test 2: Query httpcheck metrics via PromQL
Once Prometheus has been scraping for at least one interval, run PromQL queries to confirm the data is stored and queryable.
# Query httpcheck endpoint status
curl -s "http://localhost:9090/api/v1/query" \
  --data-urlencode 'query=redfish_httpcheck_status' | \
  python3 -c "
import sys,json
d=json.load(sys.stdin)
results=d['data']['result']
print(f'Total endpoints: {len(results)}')
up = sum(1 for r in results if r['value'][1]=='1')
down = len(results) - up
print(f'  UP:   {up}')
print(f'  DOWN: {down}')
"
Test 3: Query httpcheck response time
# Average response time across all Redfish endpoints
curl -s "http://localhost:9090/api/v1/query" \
  --data-urlencode 'query=avg(redfish_httpcheck_duration_seconds) * 1000' | \
  python3 -c "
import sys,json
d=json.load(sys.stdin)
val=d['data']['result'][0]['value'][1]
print(f'Average Redfish API response time: {float(val):.1f} ms')
"
Test 4: Validate a PromQL recording rule
If you are adding recording rules to prometheus.yml, validate them with promtool before applying:
# Create a test rules file
cat > /tmp/test-rules.yml << 'EOF'
groups:
  - name: redfish-aggregations
    rules:
      - record: redfish:chassis:power_consumed_watts:avg
        expr: avg by (chassis_id) (redfish_chassis_power_consumed_watts)
      - record: redfish:chassis:thermal:max_celsius
        expr: max by (chassis_id) (redfish_chassis_thermal_temperature_celsius)
EOF

# Validate the rules file
sudo docker compose run --rm \
  -v /tmp/test-rules.yml:/test-rules.yml:ro \
  promtool \
  check rules /test-rules.yml
Test 5: Confirm the collector self-metrics are scraping
The collector exposes its own internal metrics on port 8888. Prometheus scrapes these via the prometheus/self receiver. Verify they are queryable.
# Check collector uptime is being tracked
curl -s "http://localhost:9090/api/v1/query" \
  --data-urlencode 'query=redfish_otelcol_process_uptime_seconds' | \
  python3 -c "
import sys,json
d=json.load(sys.stdin)
r=d['data']['result']
if r:
    uptime=float(r[0]['value'][1])
    print(f'collector uptime: {uptime:.0f}s ({uptime/60:.1f} min)')
else:
    print('No uptime metric — check prometheus/self receiver')
"
A complete end-to-end pipeline test
The most valuable test combines both tools to validate the full signal path from emission to storage.
echo "=== End-to-end pipeline test ==="

# Step 1: Send a known span via otel-cli
echo "Step 1: Sending test span..."
sudo docker compose run --rm otel-cli span \
  --service "pipeline-test" \
  --name "e2e.test.span" \
  --attrs "test.id=e2e-001,host.name=Chassis-1,type=RESOURCE"
sleep 5

# Step 2: Verify httpcheck metrics in Prometheus
echo "Step 2: Checking httpcheck metrics..."
ENDPOINT_COUNT=$(curl -s "http://localhost:9090/api/v1/query" \
  --data-urlencode 'query=count(redfish_httpcheck_status)' | \
  python3 -c "import sys,json; d=json.load(sys.stdin); print(d['data']['result'][0]['value'][1])")
echo "  Redfish endpoints tracked: $ENDPOINT_COUNT"

# Step 3: Verify Jaeger received the span
echo "Step 3: Checking Jaeger for pipeline-test service..."
SERVICES=$(curl -s http://localhost:16686/api/services | \
  python3 -c "import sys,json; print(json.load(sys.stdin).get('data',[]))")
echo "  Jaeger services: $SERVICES"

# Step 4: Validate prometheus.yml
echo "Step 4: Validating prometheus.yml..."
sudo docker compose run --rm \
  -v ~/sivabala/siva-sdk/poc-v2/prometheus.yml:/prometheus.yml:ro \
  promtool check config /prometheus.yml 2>&1 | tail -2

echo ""
echo "=== Pipeline test complete ==="
What to check in the zpages UI during the demo
The zpages interface at http://<EC2-IP>:55679 is particularly useful during live demonstrations because it shows the pipeline working in real time. Here is what I highlight for each page:
/debug/pipelinez — Shows all five pipelines (metrics/agent, metrics/httpcheck, metrics/self, logs, traces) with their receiver and exporter connections. After running the otel-cli tests, the signal counters on this page should be non-zero.
/debug/tracez — Shows recently sampled traces. After the otel-cli span tests, you should see redfish.poll_cycle and e2e.test.span entries here.
/debug/servicez — Shows collector version and all active extensions. Confirms that zpages and health_check extensions are running.
Conclusion and what comes next
I now have a fully verified the pipeline with two powerful testing tools integrated into the stack. I can inject arbitrary OTel signals without writing application code, validate Prometheus configuration before applying it, and run PromQL queries to confirm data is reaching storage correctly.
More importantly, I have separated concerns cleanly: the local stack works correctly in isolation, tested independently of HPE OpsRamp. This means that when I connect HPE OpsRamp in the next articles, I know exactly what the pipeline delivers and any issues are isolated to the HPE OpsRamp integration layer.
In Part 4, I will write the Python instrumentation code — the OTel agent that polls Redfish and produces real per-chassis metrics — and configure the Prometheus remote_write path to push those metrics into HPE OpsRamp. The critical design decision in Part 4 is the resource association mechanism: how every metric carries type="RESOURCE" and uuid="<resourceUUID>" so HPE OpsRamp can link signals to their managed resources.\
\
Stay tuned to the HPE Developer Community blog for more insights on HPE OpsRamp (Hybrid Cloud Observability) and practical ideas to apply it in your daily operations.
Related

Automating HPE OpsRamp Software with Terraform: Infrastructure as Code for autonomous IT operations
May 25, 2026How to Transform IT Operations with AI-Infused, Full-Stack Observability
Dec 2, 2024HPE OpsRamp Continues to Push Autonomous IT Operations Forward
Dec 2, 2024
Hybrid observability service – Part 1: Provisioning and activation in HPE GreenLake Flex Solutions
May 22, 2025Hybrid observability service – Part 2: Initial configuration to enable the discovery of resources in HPE GreenLake Flex Solutions
May 23, 2025Hybrid observability service – Part 4: Enabling the monitoring of physical devices in HPE GreenLake Flex Solutions
May 27, 2025Hybrid observability service – Part 3: Enabling the monitoring of agentless SSH-enabled systems in HPE GreenLake Flex Solutions
May 26, 2025