

Even if you are not a hard-core developer, you may have heard about the open source search and analytics engine ELK. The acronym ELK stands for Elasticsearch + Logstash + Kibana. Though many have heard the term ELK, some have never really had any hands-on experience with it. This was the case with me until it was decided the HPE DEV team would offer software code challenges during our recent HPE Discover Virtual Experience.
The team was faced with the difficult task of having to monitor all the registrations that came in for these challenges over the course of the multi-week event, as well as identify those who finished them and when. Since the HPE Discover Virtual Experience was a worldwide event, registrations for any of our four code challenges could come in at anytime from anywhere on Earth. I decided to put ELK to the test to see if it could help us figure this out.
What is ELK?
ELK is a highly-scalable distributed, open source search and analytics engine used for all types of structured and unstructured data, including textual, numerical, and geospatial. Kibana is an open source data visualization dashboard created for Elasticsearch. Logstash, also part of the stack, is a server‑side data processing pipeline that ingests data from multiple sources simultaneously, transforms it, and then sends it to a "stash" like Elasticsearch.
Elasticsearch started as an open source project and, like many open source projects, grew exponentially from a few downloads in 2010 to 250 million downloads in 2018. Out of this open source maelstrom came additional software components, such as Logstash and Kibana, which now complete this very popular software stack. The Elastic business model adds commercial software on top of the open source ELK Stack.
To support those attempting our code challenges, we initially set up a Slack Channel on our Slack workspace monitored by enough team members to cover all time zones. The registration process was designed to automatically spawn a dedicated notebook environment on the JupyterHub server in our datacenter and send mails to customers to get them connected to start working on their challenge.
While all data relative to the registration process was stored in a database, we didn’t have time to build a front-end application to manage this information, so not all support staff had access to it. We were left with the question: how would each of us know if there were one or more challenges going on at any point in time? We needed some sort of dashboard to display this information that all team members could quickly look at, from anywhere, at any time.
Keep it simple
Being tasked with building a dashboard meant I could finally get my hands dirty with ELK. Within a few minutes, I had both Elasticsearch and Kibana installed on the Linux virtual machine on which our registration process was hosted. It was easy to do, as I used the Elastic web site, which has extremely precise installation instructions for both Elasticsearch and Kibana. Though I had the Elasticsearch instance, its store was empty and I still needed to feed data to it. I needed to get the right data store there before I could build a Kibana dashboard.
There is an API? Then yes, we can do it
There is only one way to interact with Elasticsearch and it’s using its API which by default, installs on port 9200. If this is a problem for you, please take a look at my article on understanding the basic principles of REST API.
My colleague Pramod, who had built the registration process application, was smart enough to provide a REST API to its backend application. This enabled me to retrieve from the database:
- Customer details
- Challenge details
- Booking details
The API returned JSON. Elasticsearch also uses JSON, so it all looked too easy, giving the impression that I only needed:
- One REST API call to retrieve customer data from the registration application
- Another API call to upload this data into Elasticsearch
NDJSON?
It turns out that it wasn’t quite as easy as that. In order to bulk upload data in Elasticsearch, you have to feed it with not JSON but NDJSON, which I had never heard of. NDJSON stands for Newline Delimited JSON. So, it looked like a little data massaging exercise was needed.
So, my new algorithm was:
- GET JSON customer data from registration App customer API
- Prepare JSON data for bulk load
- POST NDJSON data to Elasticsearch customer index in bulk mode
Trial and error
I experimented with the Elasticsearch REST API for a few hours in order to create a customer index and populate data for this index. I exclusively used the following single call to get this done:
curl -H "Content-Type:application/x-ndjson" -X POST "http://localhost:9200/customers/_bulk" --data-binary @customers.json
When things went wrong with the format of my NDJSON file, I deleted my index and restarted fresh using:
curl -H "Content-Type:application/x-ndjson" -X DELETE "http://localhost:9200/customers”
There are a lot of great articles available to help with formatting the data for bulk import, but this particular one was of great help to me.
I found that calling our own application to retrieve customer details was easy enough. I finally had all the individual pieces nailed down. All I needed next was to write a script to orchestrate all of this.
My worst nightmare: Regular Expressions
I know there are lots of programming languages that can perform powerful string manipulations. Specifically, I wanted something quick (like bash?), which didn’t require anything else installed on the system (like bash?), so I decided to manipulate the JSON file using a simple sed command in a bash (yes bash!) script. My regular expressions were a little rusty, so I struggled a bit, but I got help from a hard-core Linux colleague (who prefers to remain anonymous, but writes lots of great Redfish blog posts for us). His motto is “I can do anything with a RegEx!”. So finally, I managed to turn the input JSON data into ready-to-be-imported NDJSON.
Note: It did require five successive sed commands, not just a single one as anticipated.
That was it! I now had a script that would load the latest customer configuration into my Elasticsearch. I added this script in a cron table on our server, so it ran every 15 minutes, and I was now ready to move on to building the dashboard.
Simple yet secure
Kibana has a web interface that, by default, starts on port 5601. However, for a more secure approach, we used nginx (which was already installed on our server) as a reverse proxy for Kibana. I found a great article that helped me handle this configuration.
The steps involve manipulating nginx configuration files under /etc/nginx/sites-available to:
- Create a kibanaadmin user using basic authentication
- Create a reverse proxy from our system port 8080 to Kibana 5601
- Enable SSL
Our config file looked like this:
server {

  listen [::]:8080 ssl ipv6only=on; # managed by Certbot
  listen 8080 ssl; # managed by Certbot
  ssl_certificate /etc/letsencrypt/live/ourservernamegoeshere/fullchain.pem; # managed by Certbot
    ssl_certificate_key /etc/letsencrypt/live/ourservernamegoeshere /privkey.pem; # managed by Certbot
    include /etc/letsencrypt/options-ssl-nginx.conf; # managed by Certbot
    ssl_dhparam /etc/letsencrypt/ssl-dhparams.pem; # managed by Certbot

    server_name ourservernamegoeshere.hpedev.io;

    auth_basic "Restricted Access";
    auth_basic_user_file /etc/nginx/htpasswd.users;

    location / {
        proxy_pass http://localhost:5601;
        proxy_http_version 1.1;
        proxy_set_header Upgrade $http_upgrade;
        proxy_set_header Connection 'upgrade';
        proxy_set_header Host $host;
        proxy_cache_bypass $http_upgrade;
    }
}
`
After restarting nginx, the team could log into our Kibana web interface from anywhere and start building shiny dashboards.## It’s dashboard time!
Kibana dashboards are made of individual tiles called virtualizations and Kibana offers lots of different virtualization widgets.
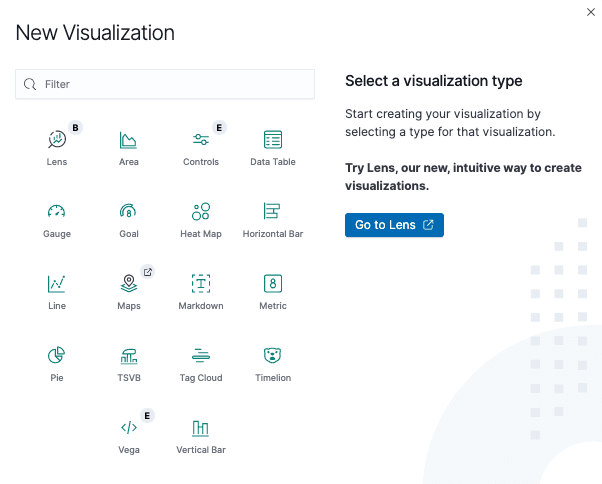
As you can see, there are many types of visualization tools you can use and configure using the fields found in your index. In our case, we had the following data available in our customers’ index:
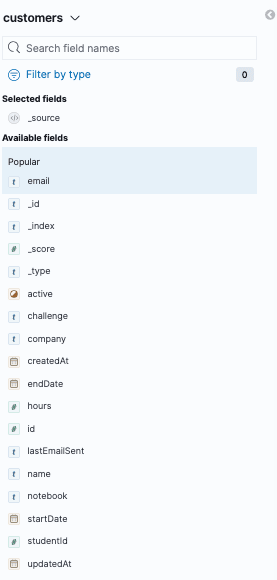
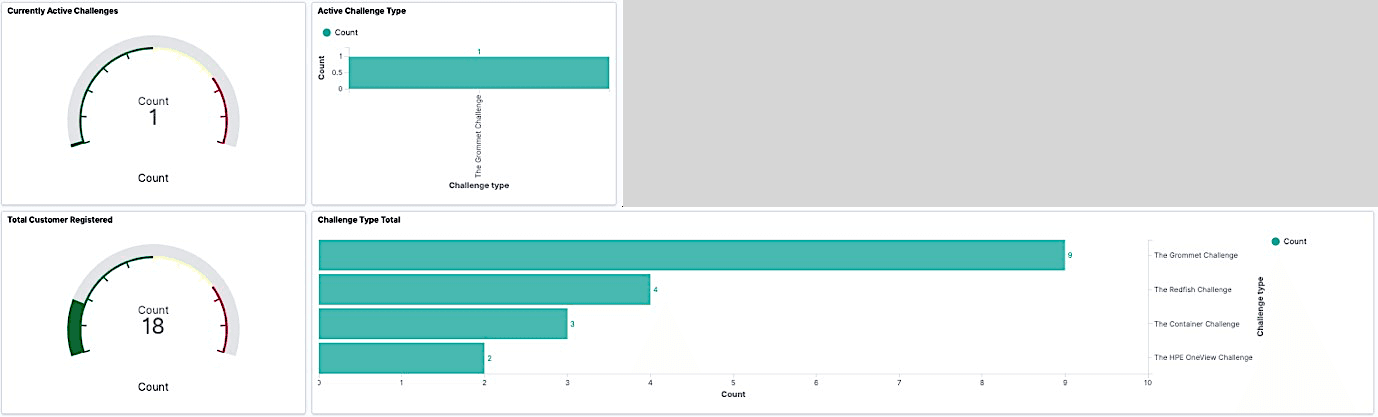
I decided to keep it simple and visualise the following data points:
- Total number of active challenges
- Active challenges by type
- Total customers who registered
- Total challenges that were taken
In no time, I was able to get my first version of a challenge dashboard.
It was a good start, but I also wanted to know when the active challenges had started. So, I decided to add another visualisation to show the start time in a Date Histogram, as shown below.
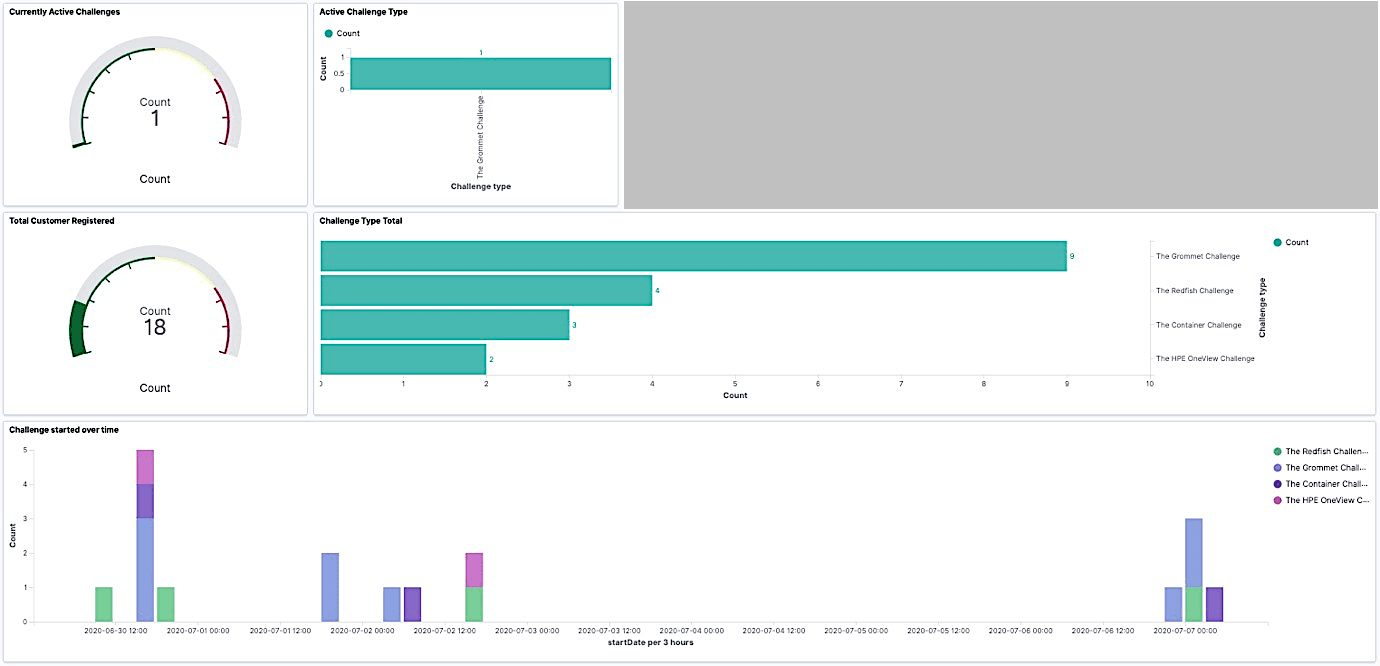
This looked really nice because, not only could we immediately see if there were challenges in flight, but we could also check what happened during the previous night, for example.
There is an API? Then yes, we can do it… again
Because our challenge participants had to use Github to collect the source material for the challenges and open pull requests (PR) to submit their responses, the next thing that we wanted to visualise was activity on the GitHub repos. But wait, GitHub has an API right?
Absolutely! So, I went back to the data collection script, and now that I knew about NDJSON and regex, I was able to collect data for each of our Github repos in no time using their APIs:
- Number of Forks
- Number of Pull Requests
I created a new index in Elasticsearch for Github data and updated my script to load the Github data like I had done previously (more sed and regex). Finally, I created a new tile to visualize the GitHub data.
Et voilà:

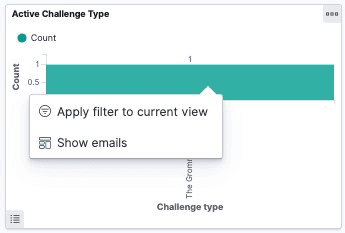
Ready to drill down?
There were so many things we could have added to our dashboard; it seemed limitless. But I discovered that you could actually drill down by right-clicking on certain tiles. So, I decided to implement drill down to display the emails of our participants. That was a nice enhancement as it allowed us to immediately know who was participating and be in a position to provide support. Again, even that was pretty easy and smooth, even for a newbie in Kibana.
Conclusion
I’ve only scratched the surface of what you can do with the ELK Stack in this post. And this was a result of spending just a few hours on it only using the community part of the stack. There is a lot more to the ELK Stack, both in terms of data that we could feed in (complete system monitoring using Beats/Logstash for example) and Kibana widgets we can use to display data in various forms. Give it a try and, like me, you may get instantaneously hooked. Don’t forget to check back on our HPE DEV blog for more tutorials on interesting open source topics.
Related

10 Myths About Scalable Parallel Programming Languages (Redux), Part 1: Productivity and Performance
Apr 30, 202510 Myths About Scalable Parallel Programming Languages (Redux), Part 2: Past Failures and Future Attempts
Jun 2, 202510 Myths About Scalable Parallel Programming Languages (Redux), Part 3: New Languages vs. Language Extensions
Jun 26, 202510 Myths About Scalable Parallel Programming Languages (Redux), Part 4: Syntax Matters
Jul 23, 202510 Myths About Scalable Parallel Programming Languages (Redux), Part 5: Productivity and Magic Compilers
Aug 21, 202510 Myths About Scalable Parallel Programming Languages (Redux), Part 6: Performance of Higher-Level Languages
Sep 18, 202510 Myths About Scalable Parallel Programming Languages (Redux), Part 7: Minimalist Language Designs
Oct 15, 2025