
Addressing hybrid cloud application challenges using HPE GreenLake for Private Cloud Enterprise – Part 2: Application monitoring
January 6, 2023Introduction
In my previous blog post, I covered the detailed process of deploying the complex Online Boutique application in a hybrid cloud environment, across the public EKS cluster from AWS to the private Kubernetes cluster in HPE GreenLake for Private Cloud Enterprise. This hybrid cloud model amplifies the benefits of both private and public clouds and allows for more seamless integration across technical barriers. It enables the enterprise to rely on the security of on-premises data centers while taking advantage of the agility of managing the front-end of an application in the public cloud. This model is becoming increasingly popular as more businesses and enterprises shift toward cloud-based computing.
However, this evolution presents challenges for monitoring, as applications and services are inherently more distributed in this environment. Having a good application performance monitoring (APM) tool is becoming essential within the hybrid cloud environment. It can consolidate performance metrics and troubleshoot data for assets across the hybrid cloud environment into a single application. It makes it easier to track metrics and allows the enterprise to resolve problems quickly.
For this blog post, I chose Apache SkyWalking as an APM tool and describe how to set up it, as a self-hosted APM tool, for monitoring and alerting the application performance across the hybrid cloud environment. I took the service mesh as an auto instrumentation mechanism for application monitoring, without adding any manual process to instrument existing applications.
Apache SkyWalking
Apache SkyWalking is an open source APM tool that can monitor, trace, and diagnose distributed systems. It’s especially designed for microservices, cloud native and container-based architectures.
Apart from a list of supported agents to be used for instrumenting applications, Apache SkyWalking implements an Envoy Access Log Service (ALS) based solution to provide observability on the service mesh under Kubernetes environment, no matter the architecture or language. A service mesh provides a mesh of Layer 7 proxies that manage network traffic between services. It supports application observability at the platform layer, instead of the application layer, by abstracting away how inter-process and service-to-service communications being handled in Kubernetes. Using a list of implemented analyzers, e.g., k8s-mesh and mx-mesh, Apache SkyWalking can receive and analyze the detailed access logs of all requests, both HTTP and TCP, emitted from Envoy ALS. With this solution, users could get the application service topology map, metrics graph, request details and error message with a very nice visualization. This observation solution is much easier to be added without language-specific technology. It can be extremely important for monitoring and visualizing applications that consist of many microservices running across on-premises, cloud-based or hybrid environments.
Apache SkyWalking is lightweight and scalable. It can be easily set up as a self-hosted APM tool within a hybrid cloud environment, without any additional external resources for hosting the tool. This can help in the context of a resource-constrained environment and remove the privacy and security concerns customers may have in putting customer data that goes out to third-party services.
Set up Apache SkyWalking
Prerequisites
Before you start, make sure you have the following required elements:
- A public Kubernetes cluster from one of the public cloud providers such as AWS, Microsoft Azure or Google. For the purposes of this case study blog post, one EKS cluster, named eks-cfe-public from AWS, is used. However, it works if you choose a cluster from other providers.
- A private Kubernetes cluster, named eks-pce-clu-1 provisioned in HPE GreenLake for Private Cloud Enterprise.
- The kubectl CLI tool, version 1.23 or later, together with the kubeconfig files for accessing both public and private clusters.
- The Helm CLI tool, version 3.8.1 or later.
- The istioctl CLI tool, version 1.16.0 or later. Use the istioctl Installation to install this CLI tool to your local development environment. The istioctl client will be used for installing and set up Istio service mesh.
- The Skupper CLI tool, the latest version 1.2.0. Use the Skupper Installation to install this CLI tool to your local development environment.
Deploy Apache SkyWalking to AWS EKS cluster
Install Apache SkyWalking using Helm charts with elasticsearch as storage to the public AWS EKS cluster:
$ git clone https://github.com/apache/skywalking-kubernetes
$ cd skywalking-kubernetes/chart
$ helm repo add elastic https://helm.elastic.co
$ helm dep up skywalking
$ kubectl create ns skywalking
$ helm install skywalking skywalking –n skywalking \
--set oap.image.tag=9.2.0 \
--set ui.image.tag=9.2.0 \
--set oap.storageType=elasticsearch \
--set elasticsearch.imageTag=7.17.1 \
--set elasticsearch.persistence.enabled=true \
--set values.telemetry.v2.enabled=true \
--set oap.envoy.als.enabled=true \
--set oap.env.SW_ENVOY_METRIC_ALS_HTTP_ANALYSIS=mx-mesh \
--set oap.env.SW_ENVOY_METRIC_ALS_TCP_ANALYSIS=mx-mesh
Above the Helm commands, install the Apache SkyWalking to the namespace skywalking of the AWS EKS cluster. It uses the elasticsearch as the storage type and creates it as a StatefulSet resource, running a pod on each worker node. It installs the Apache SkyWalking Observability Analysis Platform (OAP) with replicas being set as 2 to ensure high availability. The installation enables the Envoy Access Log Service (ALS) and specifies the ALS analyzer as mx-mesh.
It should be noted that Apache SkyWalking also supports the ALS analyzer k8s-mesh, which uses the metadata from Kubernetes cluster to analyze the logs. It requires the SkyWalking OAP server to access the Kubernetes API server to get information of pods, services and service endpoints. This works only for monitoring a single cloud environment. In the case of a hybrid cloud, you need to use the ALS analyzer mx-mesh, which uses the Envoy metadata exchange mechanism to get the service names. It's required for monitoring applications deployed in the hybrid cloud environment.
You can check the detailed Apache SkyWalking installation by typing the following kubectl command:
$ kubectl get all -n skywalking
NAME                                                 READY   STATUS      RESTARTS   AGE
pod/elasticsearch-master-0                           1/1     Running     0          6h34m
pod/elasticsearch-master-1                           1/1     Running     0          6h34m
pod/skywalking-oap-init-n92hp                        1/1     Completed   0          88s
pod/skywalking-skywalking-helm-oap-bfb57fbf8-27frm   1/1     Running     0          92s
pod/skywalking-skywalking-helm-oap-bfb57fbf8-djzw5   1/1     Running     0          52s
pod/skywalking-skywalking-helm-ui-7776f4854d-nvkds   1/1     Running     0          6h34m

NAME                                     TYPE        CLUSTER-IP       EXTERNAL-IP   PORT(S)               AGE
service/elasticsearch-master             ClusterIP   172.20.171.140   <none>        9200/TCP,9300/TCP     6h34m
service/elasticsearch-master-headless    ClusterIP   None             <none>        9200/TCP,9300/TCP     6h34m
service/skywalking-skywalking-helm-oap   ClusterIP   172.20.155.177   <none>        11800/TCP,12800/TCP   6h34m
service/skywalking-skywalking-helm-ui    ClusterIP   172.20.205.170   <none>        80/TCP                6h34m

NAME                                             READY   UP-TO-DATE   AVAILABLE   AGE
deployment.apps/skywalking-skywalking-helm-oap   2/2     2            2           6h34m
deployment.apps/skywalking-skywalking-helm-ui    1/1     1            1           6h34m

NAME                                                        DESIRED   CURRENT   READY   AGE
replicaset.apps/skywalking-skywalking-helm-oap-bfb57fbf8    2         2         2       96s
replicaset.apps/skywalking-skywalking-helm-ui-7776f4854d    1         1         1       6h34m

NAME                                    READY   AGE
statefulset.apps/elasticsearch-master   2/2     6h34m

NAME                            COMPLETIONS   DURATION   AGE
job.batch/skywalking-oap-init   1/1           31s        94s
Change the service types for both service skywalking-skywalking-helm-oap and skywalking-skywalking-helm-ui from ClusterIP to LoadBalancer. With the built-in support of Elastic Load Balancing (ELB) in AWS EKS cluster, the externally accessible load balancing host names will be created for those two services in the Apache SkyWalking installation.
$ kubectl edit service/skywalking-skywalking-helm-ui -n skywalking
$ kubectl edit service/skywalking-skywalking-helm-oap -n skywalking

$ k get svc -n skywalking -l app=skywalking
NAME                             TYPE           CLUSTER-IP       EXTERNAL-IP                                                              PORT(S)                           AGE
skywalking-skywalking-helm-oap   LoadBalancer   172.20.155.177   afd4a163a65c74af5ad732fcf86b7dff-261027448.us-east-2.elb.amazonaws.com   11800:30642/TCP,12800:32269/TCP   38d
skywalking-skywalking-helm-ui    LoadBalancer   172.20.205.170   a2dea6e89216444e28ed29ef48c0b0fa-951983485.us-east-2.elb.amazonaws.com   80:31740/TCP                      38d
The Apache SkyWalking UI can be made (publicly) accessible using the assigned URL http://a2dea6e89216444e28ed29ef48c0b0fa-951983485.us-east-2.elb.amazonaws.com/. The Apache SkyWalking OAP server ELB host name with its port 11800, afd4a163a65c74af5ad732fcf86b7dff-261027448.us-east-2.elb.amazonaws.com:11800, will be used in the following configuration to send the application metrics.
Install Istio service mesh
Install istio service mesh using istioctl with Envoy Access Log Service enabled:
$ kubectl create ns istio-system
$ istioctl install -y --set profile=demo \
--set meshConfig.enableEnvoyAccessLogService=true \
--set meshConfig.defaultConfig.envoyAccessLogService.address=afd4a163a65c74af5ad732fcf86b7dff-261027448.us-east-2.elb.amazonaws.com:11800 \
--set meshConfig.defaultConfig.envoyMetricsService.address=afd4a163a65c74af5ad732fcf86b7dff-261027448.us-east-2.elb.amazonaws.com:11800 \
--set 'meshConfig.defaultConfig.proxyStatsMatcher.inclusionRegexps[0]=.*'
Run the above commands on both the AWS EKS cluster and the private Kubernetes cluster. It installs the istio to the namespace istio-system of the clusters. It explicitly enables the Envoy Access Log Service (ALS), with both envoyAccessLogService.address and envoyMetricsService.address settings pointing to the Apache SkyWalking OAP server ELB host name and its port 11800.
You can check the detailed istio installation by typing the following kubectl command:
$ kubectl get all -n istio-system
NAME                                        READY   STATUS    RESTARTS   AGE
pod/istio-egressgateway-78fb5cf46-djxv2     1/1     Running   0          38d
pod/istio-ingressgateway-77b9d69b74-499vf   1/1     Running   0          38d
pod/istiod-67fcb675b5-2dhjw                 1/1     Running   0          38d

NAME                           TYPE           CLUSTER-IP      EXTERNAL-IP                                                               PORT(S)                                                                      AGE
service/istio-egressgateway    ClusterIP      172.20.224.42   <none>                                                                    80/TCP,443/TCP                                                               38d
service/istio-ingressgateway   LoadBalancer   172.20.249.41   a17641fd9b6564b02ab3cc5faeb51e7a-1241343104.us-east-2.elb.amazonaws.com   15021:30506/TCP,80:31341/TCP,443:31933/TCP,31400:31131/TCP,15443:32118/TCP   38d
service/istiod                 ClusterIP      172.20.95.232   <none>                                                                    15010/TCP,15012/TCP,443/TCP,15014/TCP                                        38d

NAME                                   READY   UP-TO-DATE   AVAILABLE   AGE
deployment.apps/istio-egressgateway    1/1     1            1           38d
deployment.apps/istio-ingressgateway   1/1     1            1           38d
deployment.apps/istiod                 1/1     1            1           38d

NAME                                              DESIRED   CURRENT   READY   AGE
replicaset.apps/istio-egressgateway-78fb5cf46     1         1         1       38d
replicaset.apps/istio-ingressgateway-77b9d69b74   1         1         1       38d
replicaset.apps/istiod-67fcb675b5                 1         1         1       38d
Deploy Online Boutique application
Please refer to my blog post here on how to deploy the Online Boutique application across the public AWS EKS cluster and the private Kubernetes cluster in HPE GreenLake for Private Cloud Enterprise. The Skupper CLI tool is used for deploying the Virtual Application Network (VAN) and creating connection between the private Kubernetes cluster and the public AWS EKS cluster.
After deploying the Online Boutique application, you can verify deployment by checking the Skupper status from the deployment namespace boutique:
- from private Kubernetes cluster:
$ skupper status --namespace boutique
Skupper is enabled for namespace "boutique" with site name "pce-private" in interior mode.
It is connected to 1 other site. It has 10 exposed services.
- from AWS EKS cluster:
$ skupper status --namespace boutique
Skupper is enabled for namespace "boutique" with site name "aws-public" in interior mode.
It is connected to 1 other site. It has 10 exposed services.
The site console url is: https://aea867abf6fb6413d8f577652da564c1-130946084.us-east-2.elb.amazonaws.com:8080
The credentials for internal console-auth mode are held in secret: 'skupper-console-users‘
The Skupper console shows the connections from the public AWS EKS cluster to the private Kubernetes cluster and the hybrid deployment of the Online Boutique application:
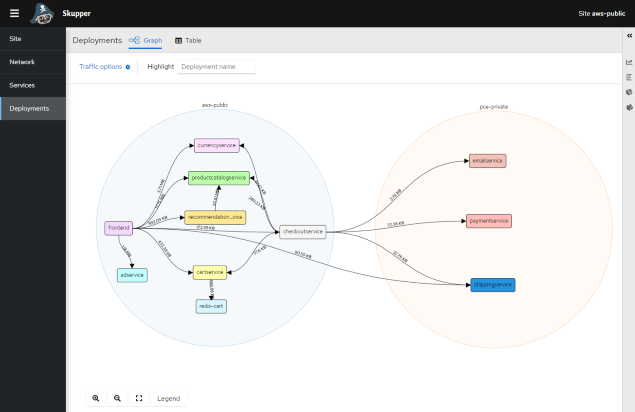
The Online Boutique UI can be accessed through deployed frontend service URL from public AWS EKS cluster:

Online Boutique application monitoring using ALS
1 Add the label istio-injection=enabled to namespace boutique
Run the following command, from both the AWS EKS cluster and the private Kubernetes cluster, to add the label istio-injection=enabled to the namespace boutique, in which the Online Boutique application is deployed. This will enable istio injection for this namespace:
$ kubectl label namespace boutique istio-injection=enabled
$ kubectl get ns boutique --show-labels
NAME       STATUS   AGE   LABELS
boutique   Active   3d   istio-injection=enabled,kubernetes.io/metadata.name=boutique
2 Restart Online Boutique application deployment
Run the following command from both the AWS EKS cluster and the private Kubernetes cluster:
$ kubectl rollout restart deployment
This command will restart all the deployments in the namespace boutique by terminating the related pods and re-creating them. Since the namespace has the label istio-injection=enabled added, the newly created pods will be injected automatically with the istio-proxy container. The PROXY_CONFIG in the istio-proxy container contains the configuration of envoyAccessLogService.address and envoyMetricsService.address, both pointing to the Apache SkyWalking OAP server URL:
  istio-proxy:
    Container ID:  docker://2e0fa0a4e290a0138e59fe11e4bd4cdaffa329e5b780e9ed227089bb10660c73
    Image:         docker.io/istio/proxyv2:1.16.0
    Image ID:      docker-pullable://istio/proxyv2@sha256:f6f97fa4fb77a3cbe1e3eca0fa46bd462ad6b284c129cf57bf91575c4fb50cf9
    Port:          15090/TCP
    Host Port:     0/TCP
    Args:
      proxy
      sidecar
      --domain
      $(POD_NAMESPACE).svc.cluster.local
      --proxyLogLevel=warning
      --proxyComponentLogLevel=misc:error
      --log_output_level=default:info
      --concurrency
      2
    State:          Running
      Started:      Fri, 02 Dec 2022 16:34:23 +0100
    Ready:          True
    Restart Count:  0
    Limits:
      cpu:     2
      memory:  1Gi
    Requests:
      cpu:      10m
      memory:   40Mi
    Readiness:  http-get http://:15021/healthz/ready delay=1s timeout=3s period=2s #success=1 #failure=30
    Environment:
      JWT_POLICY:                    third-party-jwt
      PILOT_CERT_PROVIDER:           istiod
      CA_ADDR:                       istiod.istio-system.svc:15012
      POD_NAME:                      productcatalogservice-77589df479-p2p2c (v1:metadata.name)
      POD_NAMESPACE:                 boutique (v1:metadata.namespace)
      INSTANCE_IP:                    (v1:status.podIP)
      SERVICE_ACCOUNT:                (v1:spec.serviceAccountName)
      HOST_IP:                        (v1:status.hostIP)
      PROXY_CONFIG:                  {"envoyAccessLogService":{"address":"afd4a163a65c74af5ad732fcf86b7dff-261027448.us-east-2.elb.amazonaws.com:11800"},"envoyMetricsService":{"address":"afd4a163a65c74af5ad732fcf86b7dff-261027448.us-east-2.elb.amazonaws.com:11800"},"proxyStatsMatcher":{"inclusionRegexps":[".*"]}}

      ISTIO_META_POD_PORTS:          [
                                         {"containerPort":3550,"protocol":"TCP"}
                                     ]
      ISTIO_META_APP_CONTAINERS:     server
      ISTIO_META_CLUSTER_ID:         Kubernetes
      ISTIO_META_INTERCEPTION_MODE:  REDIRECT
      ISTIO_META_WORKLOAD_NAME:      productcatalogservice
      ISTIO_META_OWNER:              kubernetes://apis/apps/v1/namespaces/boutique/deployments/productcatalogservice
      ISTIO_META_MESH_ID:            cluster.local
      TRUST_DOMAIN:                  cluster.local```
It should be noted that, in order to avoid collecting ALS logs for the Skupper deployments (e.g., skupper-router & skupper-service-controller deployed to the same namespace that are used for multicloud communication and hybrid application deployment), we can add the annotation sidecar.istio.io/inject: false to those Skupper deployments. After restart deployments, the Skupper deployments will not inject the istio-proxy to their pods.
3 Monitor Online Boutique application
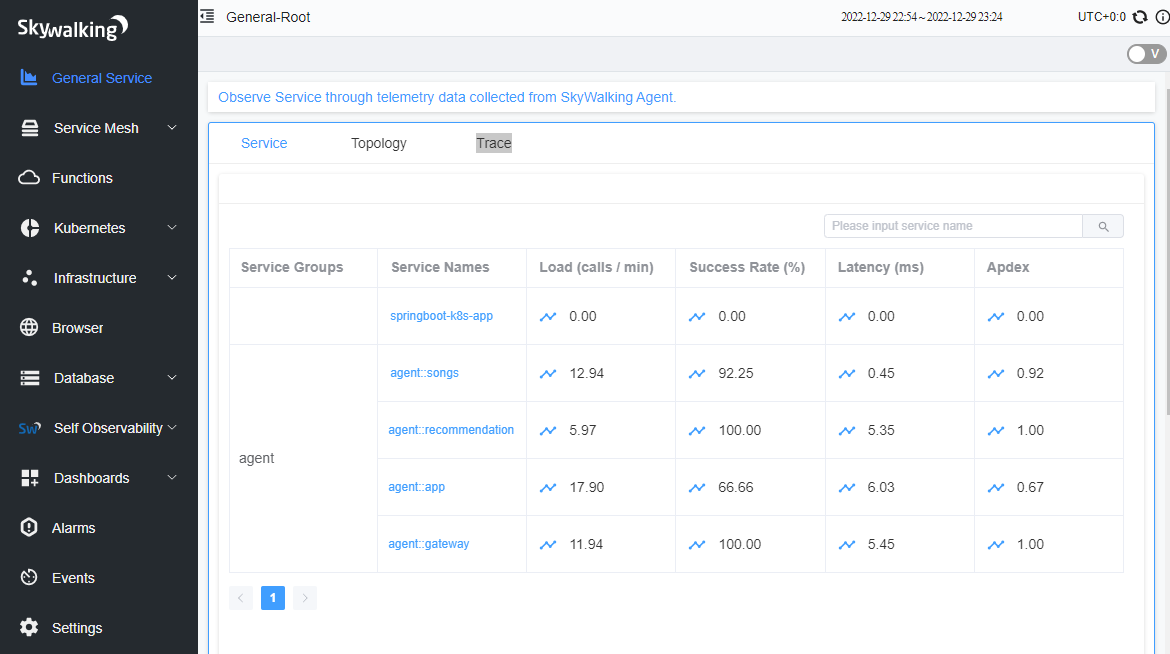
After following these steps, the Online Boutique application metrics will be visible from the Apache SkyWalking UI, under the Service Mesh tab:
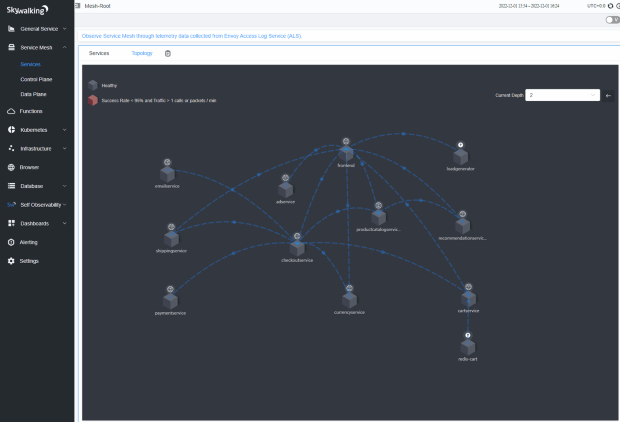
The SkyWalking UI Topology page will show the Online Boutique application topology map:
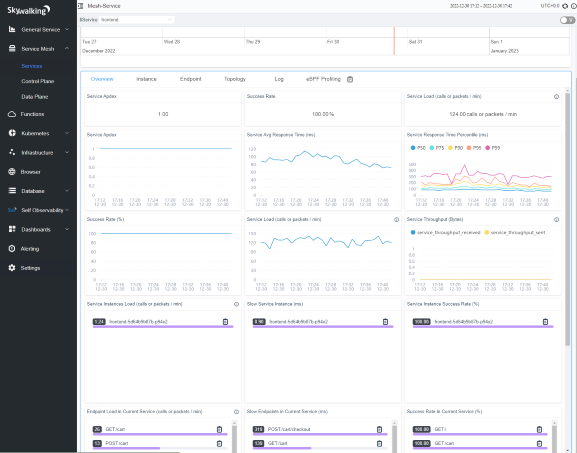
You can check the service Overview and Endpoint pages per service, e.g., frontend:
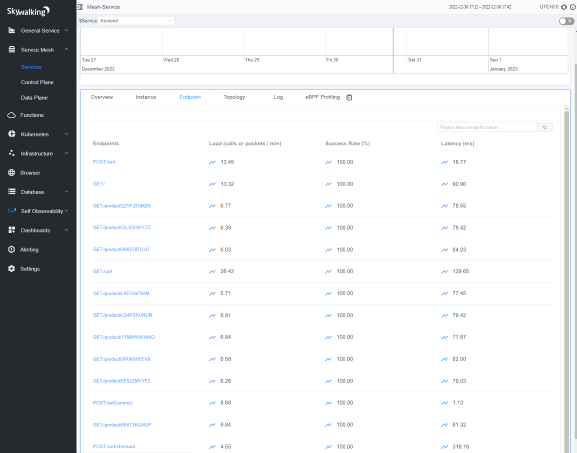
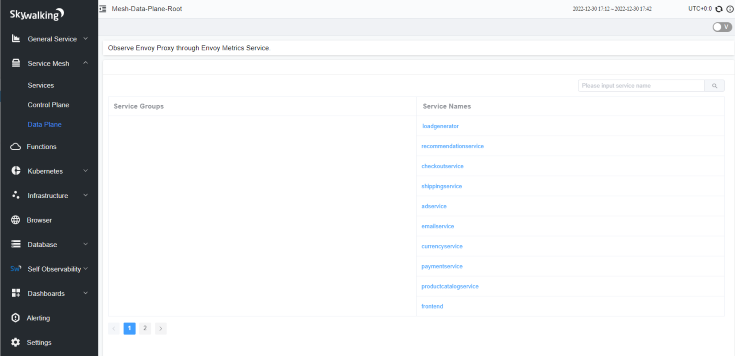
You can also check all the services from the Data Plane tab under Service Mesh that are observed through Envoy Metrics Service setup:
Online Boutique application alerting
Apache SkyWalking provides an alerting mechanism to measure application performance according to a list of pre-defined metrics, e.g., service_resp_time, service_instance_resp_time, and service_sla. It will trigger alerting when some metrics reach its pre-defined thresholds.
Apache SkyWalking configures the alerting using a collection of alerting rules located in /skywalking/config/alarm-settings.yml from the SkyWalking OAP pod. You can check the content by running the following command:
$ kukectl exec pod/skywalking-skywalking-helm-oap-bfb57fbf8-5g7k7 -n skywalking -it -- cat /skywalking/config/alarm-settings.yml
You can define new metrics by adding a new entry to the file using the SkyWalking observability analysis language (OAL), or customize the existing metrics with new thresholds.
Below is the alarms page from the SkyWalking UI showing all the triggered alerts for a deployed Online Boutique application:
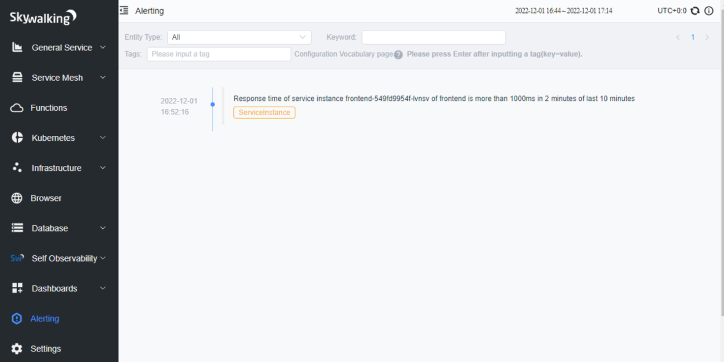
The alarms page shows an alert Response time of service instance frontend-549fd9954f-lvnsv of frontend is more than 1000ms in 2 minutes of last 10 minutes .
This alert is triggered by the following metric alerting rule for the metric service_instance_resp_time:
  service_instance_resp_time_rule:
    metrics-name: service_instance_resp_time
    op: ">"
    threshold: 1000
    period: 10
    count: 2
    silence-period: 5
message: Response time of service instance {name} is more than 1000ms in 2 minutes of last 10 minutes
It indicates an issue from the frontend service instance in Online Boutique application. You can check the service trace page further to figure out the root cause of this issue.
Conclusion
This blog post discussed the challenges in hybrid cloud monitoring and described the process of setting up Apache SkyWalking as a self-hosted APM tool for application performance monitoring across a hybrid cloud environment. Instead of taking the manual instrumentation mechanism to rebuild the application with various agents to collect and send the application metrics, we used an auto instrumentation approach with service mesh in the setup. This Envoy Access Log Service (ALS) based approach did not require any change to the deployed applications and the setup process showed that it was very easy to configure it for hybrid cloud monitoring. This integration solution can be extremely important for monitoring and visualizing an application that consists of many microservices running across hybrid cloud environments.
Tags
Related
A guide to enabling a managed Istio service mesh in a Kubernetes cluster on HPE GreenLake for Private Cloud Enterprise
Feb 16, 2023
Using HPE GreenLake Console's API Gateway for Data Services Cloud Console
Nov 30, 2021Automate ITOps: announcing foundational APIs for the HPE GreenLake edge-to-cloud platform
Dec 1, 2023
Bare metal provisioning on HPE GreenLake using Terraform
Mar 20, 2023
Bulk onboarding of users in HPE GreenLake edge-to-cloud platform
Apr 24, 2024
Configuring Azure AD as the SAML IDP with HPE Greenlake Cloud Platform and Aruba Central
Jul 11, 2022How to implement a single sign-on solution to authenticate users onto the HPE GreenLake edge-to-cloud platform
Nov 29, 2023