
Adding a monitoring stack to a Kubernetes cluster using Prometheus and Grafana in HPE GreenLake for Private Cloud Enterprise
January 25, 2024Introduction
HPE GreenLake for Private Cloud Enterprise: Containers ("containers service"), one of the HPE GreenLake cloud services available on the HPE GreenLake for Private Cloud Enterprise, allows customers to create a Kubernetes (K8s) cluster, view details about existing clusters, and deploy containerized applications to the cluster. It provides an enterprise-grade container management service using open source K8s.
In this blog post, I will discuss K8s monitoring and show you how to add a monitoring stack using Prometheus and Grafana to a K8s cluster in HPE GreenLake for Private Cloud Enterprise. By setting up Prometheus as the data source and importing different dashboard templates into Grafana, various aspects of K8s, including metrics, performance, and health, can be monitored in the K8s cluster.
Why monitor K8s
Though K8s dramatically simplifies application deployment in containers and across clouds, it adds a new set of complexities for managing, securing and troubleshooting applications. Container-based applications are dynamic and designed using microservices, where the number of components increases by an order of magnitude. K8s security is self-configured, typically being specified in code through K8s yaml manifests, Helm charts, or templating tools. Properly configuring for workloads, clusters, networks, and infrastructure is crucial for averting issues and limiting the impact if a breach occurs. Dynamic provisioning via Infrastructure as Code (IaC), automated configuration management and orchestration also add to monitoring and troubleshooting complexity. As such, K8s monitoring is critical to managing application performance, service uptime, and enabling troubleshooting. Having a good monitoring tool is essential.
Prerequisites
Before starting, make sure your setup has the following:
- A K8s cluster, being provisioned in HPE GreenLake for Private Cloud Enterprise
- Terraform, installed using these steps
- The kubectl CLI tool, together with the kubeconfig file for accessing the K8s cluster
- The Helm CLI tool, version 3.12.0 or later
Prometheus and Grafana
Prometheus is a robust open-source monitoring and alerting tool used to collect, store, query, and provide alerts on time-series data. It employs a pull-based model to gather metrics from instrumented targets and features a powerful query language (PromQL) for data analysis. It enables developers to monitor various aspects of their systems, including metrics, performance, and health.
Grafana is a powerful data visualization and monitoring tool. It serves as the interface for developers to visualize and analyze the data collected by Prometheus. With its rich set of visualization options and customizable dashboards, Grafana empowers developers to gain real-time insights into their systems’ performance, identify trends, and detect anomalies. By leveraging Grafana’s capabilities, developers can create comprehensive visual representations of their systems’ metrics, facilitating informed decision-making and proactive system management.
In the following sections, I will show you how to add a monitoring stack using Prometheus and Grafana to a K8s cluster deployed in HPE GreenLake for Private Cloud Enterprise.
Deploy Prometheus and Grafana using Terraform
Prometheus and Gafana will be deployed to the K8s cluster using the HPE GreenLake Terraform provider hpegl, together with the Helm provider from Hashicorp.
Create a Terraform config
Here is the terraform config file. You can refer to Infrastructure-as-code on HPE GreenLake using Terraform for the details about HPE GreenLake Terraform provider and its usage.
$ cat main.tf
terraform {
  required_providers {
    hpegl = {
      source  = "hpe/hpegl"
      version = ">= 0.2.2"
    }
  }
}

provider "hpegl" {
  caas {
    api_url = var.api_url
  }
}

data "hpegl_caas_cluster" "iaccluster" {
  name     = var.cluster_name
  space_id = var.space_id
}

provider "helm" {
  kubernetes {
       host     = yamldecode(base64decode(data.hpegl_caas_cluster.iaccluster.kubeconfig)).clusters[0].cluster.server
       token    = yamldecode(base64decode(data.hpegl_caas_cluster.iaccluster.kubeconfig)).users[0].user.token
       insecure = true
  }
}

resource "helm_release" "prometheus-stack" {
   name = "prometheus-stack"
   repository = "https://prometheus-community.github.io/helm-charts"
   chart = "prometheus"
   version = "23.0.0"
   namespace = "monitoring"
   create_namespace = true

   set {
    name  = "server.service.type"
    value = "NodePort"
  }

   set {
    name  = "prometheus-node-exporter.hostRootFsMount.enabled"
    value = "false"
  }

   set {
    name  = "prometheus-node-exporter.hostNetwork"
    value = "false"
  }

   set {
    name  = "prometheus-node-exporter.hostPID"
    value = "false"
  }
}

resource "helm_release" "grafana-dashboard" {
   name = "grafana-dashboard"
   repository = "https://grafana.github.io/helm-charts"
   chart = "grafana"
   version = "6.57.4"
   namespace = "monitoring"
   create_namespace = true

   set {
    name  = "service.type"
    value = "NodePort"
  }

   set {
    name  = "persistence.enabled"
    value = "true"
  }
}
There are a few things worth noting in the above Terraform configuration file:
- In Grafana, the persistence by default is disabled. In case Grafana Pod gets terminated for some reason, you will lose all your data. In production deployments, such as HPE GreenLake for Private Cloud Enterprise: Containers, this needs to be enabled, by setting persistence.enabled as true, to prevent any data loss.
- In Prometheus, the DaemonSet deployment of the node exporter tries to mount the hostPath volume to the container root “/”, which violates the deployed OPA (Open Policy Agent) policy to the K8s cluster for filesystem (FS) mount protections. As such, the DaemonSet deployment will never be ready and keeps showing the warning events as Warning FailedCreate daemonset-controller Error creating: admission webhook "soft-validate.hpecp.hpe.com" denied the request: Hostpath ("/") referenced in volume is not valid for this namespace because of FS Mount protections.. You need to disable the hostRootFsMount, together with hostNetwork and hostPID, to comply with the security policy in the cluster.
- Both Prometheus and Grafana services are deployed as NodePort service types. Those services will be mapped to the gateway host with automatically generated ports for easy access and service configuration.
Initialize working directory
With above main.tf config file, the working directory can be initialized by running the following command:
    $ terraform init

    Initializing the backend...

    Initializing provider plugins...
    - Finding hpe/hpegl versions matching ">= 0.2.2"...
    - Finding latest version of hashicorp/helm...
    - Installing hpe/hpegl v0.3.17...
    - Installed hpe/hpegl v0.3.17 (signed by a HashiCorp partner, key ID D1F277A1AC66CE3D)
    - Installing hashicorp/helm v2.10.1...
    - Installed hashicorp/helm v2.10.1 (signed by HashiCorp)

    Partner and community providers are signed by their developers.
    If you'd like to know more about provider signing, you can read about it here:
    https://www.terraform.io/docs/cli/plugins/signing.html

    Terraform has created a lock file .terraform.lock.hcl to record the provider
    selections it made above. Include this file in your version control repository
    so that Terraform can guarantee to make the same selections by default when
    you run "terraform init" in the future.

    Terraform has been successfully initialized!

    You may now begin working with Terraform. Try running "terraform plan" to see
    any changes that are required for your infrastructure. All Terraform commands
    should now work.

    If you ever set or change modules or backend configuration for Terraform,
    rerun this command to reinitialize your working directory. If you forget, other
    commands will detect it and remind you to do so if necessary.
From the output of the command run, the provider helm is also installed to the Terraform working directory in addition to the HPE GreenLake Terraform provider hpegl.
Deploy Prometheus and Grafana
Type the following command to apply the Terraform configuration and deploy Prometheus and Grafana to the K8s cluster while responding yes at the prompt to confirm the operation. You may want to first try a dry run to preview the changes to your infrastructure based on the data you provide in your Terraform file by running terraform plan.
    $ terraform apply --var-file=variables.tfvars

    Terraform used the selected providers to generate the following execution plan. Resource actions are indicated with the following symbols:
      + create

    Terraform will perform the following actions:

      # helm_release.grafana-dashboard will be created
      + resource "helm_release" "grafana-dashboard" {
          + atomic                     = false
          + chart                      = "grafana"
          + cleanup_on_fail            = false
          + create_namespace           = true
          + dependency_update          = false
          + disable_crd_hooks          = false
          + disable_openapi_validation = false
          + disable_webhooks           = false
          + force_update               = false
          + id                         = (known after apply)
          + lint                       = false
          + manifest                   = (known after apply)
          + max_history                = 0
          + metadata                   = (known after apply)
          + name                       = "grafana-dashboard"
          + namespace                  = "monitoring"
          + pass_credentials           = false
          + recreate_pods              = false
          + render_subchart_notes      = true
          + replace                    = false
          + repository                 = "https://grafana.github.io/helm-charts"
          + reset_values               = false
          + reuse_values               = false
          + skip_crds                  = false
          + status                     = "deployed"
          + timeout                    = 300
          + verify                     = false
          + version                    = "6.57.4"
          + wait                       = true
          + wait_for_jobs              = false

          + set {
              + name  = "persistence.enabled"
              + value = "true"
            }
          + set {
              + name  = "service.type"
              + value = "NodePort"
            }
        }

      # helm_release.prometheus-stack will be created
      + resource "helm_release" "prometheus-stack" {
          + atomic                     = false
          + chart                      = "prometheus"
          + cleanup_on_fail            = false
          + create_namespace           = true
          + dependency_update          = false
          + disable_crd_hooks          = false
          + disable_openapi_validation = false
          + disable_webhooks           = false
          + force_update               = false
          + id                         = (known after apply)
          + lint                       = false
          + manifest                   = (known after apply)
          + max_history                = 0
          + metadata                   = (known after apply)
          + name                       = "prometheus-stack"
          + namespace                  = "monitoring"
          + pass_credentials           = false
          + recreate_pods              = false
          + render_subchart_notes      = true
          + replace                    = false
          + repository                 = "https://prometheus-community.github.io/helm-charts"
          + reset_values               = false
          + reuse_values               = false
          + skip_crds                  = false
          + status                     = "deployed"
          + timeout                    = 300
          + verify                     = false
          + version                    = "23.0.0"
          + wait                       = true
          + wait_for_jobs              = false

          + set {
              + name  = "prometheus-node-exporter.hostNetwork"
              + value = "false"
            }
          + set {
              + name  = "prometheus-node-exporter.hostPID"
              + value = "false"
            }
          + set {
              + name  = "prometheus-node-exporter.hostRootFsMount.enabled"
              + value = "false"
            }
          + set {
              + name  = "server.service.type"
              + value = "NodePort"
            }
        }

    Plan: 2 to add, 0 to change, 0 to destroy.

    Do you want to perform these actions?
      Terraform will perform the actions described above.
      Only 'yes' will be accepted to approve.

      Enter a value: yes

    helm_release.grafana-dashboard: Creating...
    helm_release.prometheus-stack: Creating...
    helm_release.grafana-dashboard: Still creating... [10s elapsed]
    helm_release.prometheus-stack: Still creating... [10s elapsed]
    helm_release.grafana-dashboard: Still creating... [20s elapsed]
    helm_release.prometheus-stack: Still creating... [20s elapsed]
    helm_release.grafana-dashboard: Still creating... [30s elapsed]
    helm_release.prometheus-stack: Still creating... [30s elapsed]
    helm_release.grafana-dashboard: Still creating... [40s elapsed]
    helm_release.grafana-dashboard: Creation complete after 43s [id=grafana-dashboard]
    helm_release.prometheus-stack: Still creating... [40s elapsed]
    helm_release.prometheus-stack: Still creating... [50s elapsed]
    helm_release.prometheus-stack: Still creating... [1m0s elapsed]
    helm_release.prometheus-stack: Still creating... [1m10s elapsed]
    helm_release.prometheus-stack: Creation complete after 1m18s [id=prometheus-stack]

    Apply complete! Resources: 2 added, 0 changed, 0 destroyed.
Check Prometheus and Grafana
After a few minutes of Terraform running, both Prometheus and Grafana will be deployed in the K8s cluster to the namespace monitoring.
Type the following command to check the deployed monitoring resources. All the Pods should show that they are in Running states.
$ kubectl get all -n monitoring
NAME                                                           READY   STATUS    RESTARTS   AGE
pod/grafana-dashboard-5674bcd6d4-zh8zk                         1/1     Running   0          4d17h
pod/prometheus-stack-alertmanager-0                            1/1     Running   0          4d17h
pod/prometheus-stack-kube-state-metrics-6fb8684695-r7zp6       1/1     Running   0          4d17h
pod/prometheus-stack-prometheus-node-exporter-bcmt2            1/1     Running   0          4d17h
pod/prometheus-stack-prometheus-node-exporter-hgr2x            1/1     Running   0          4d17h
pod/prometheus-stack-prometheus-pushgateway-559cc996d5-jrjdn   1/1     Running   0          4d17h
pod/prometheus-stack-server-7646574d75-zswws                   2/2     Running   0          4d17h

NAME                                                TYPE        CLUSTER-IP       EXTERNAL-IP   PORT(S)        AGE
service/grafana-dashboard                           NodePort    10.97.7.23       <none>        80:30488/TCP   4d17h
service/prometheus-stack-alertmanager               ClusterIP   10.101.171.170   <none>        9093/TCP       4d17h
service/prometheus-stack-alertmanager-headless      ClusterIP   None             <none>        9093/TCP       4d17h
service/prometheus-stack-kube-state-metrics         ClusterIP   10.98.134.240    <none>        8080/TCP       4d17h
service/prometheus-stack-prometheus-node-exporter   ClusterIP   10.104.44.251    <none>        9100/TCP       4d17h
service/prometheus-stack-prometheus-pushgateway     ClusterIP   10.104.146.18    <none>        9091/TCP       4d17h
service/prometheus-stack-server                     NodePort    10.106.152.143   <none>        80:30245/TCP   4d17h

NAME                                                       DESIRED   CURRENT   READY   UP-TO-DATE   AVAILABLE   NODE SELECTOR            AGE
daemonset.apps/prometheus-stack-prometheus-node-exporter   2         2         2       2            2           kubernetes.io/os=linux   4d17h

NAME                                                      READY   UP-TO-DATE   AVAILABLE   AGE
deployment.apps/grafana-dashboard                         1/1     1            1           4d17h
deployment.apps/prometheus-stack-kube-state-metrics       1/1     1            1           4d17h
deployment.apps/prometheus-stack-prometheus-pushgateway   1/1     1            1           4d17h
deployment.apps/prometheus-stack-server                   1/1     1            1           4d17h

NAME                                                                 DESIRED   CURRENT   READY   AGE
replicaset.apps/grafana-dashboard-5674bcd6d4                         1         1         1       4d17h
replicaset.apps/prometheus-stack-kube-state-metrics-6fb8684695       1         1         1       4d17h
replicaset.apps/prometheus-stack-prometheus-pushgateway-559cc996d5   1         1         1       4d17h
replicaset.apps/prometheus-stack-server-7646574d75                   1         1         1       4d17h

NAME                                             READY   AGE
statefulset.apps/prometheus-stack-alertmanager   1/1     4d17h
Type the helm list command to show both Prometheus and Grafana helm charts and versions that are deployed to the monitoring namespace in the cluster:
$ helm list -n monitoring
NAME                 NAMESPACE     REVISION    UPDATED                                    STATUS      CHART                APP VERSION
grafana-dashboard    monitoring    1           2023-11-22 15:28:07.986364628 +0100 CET    deployed    grafana-6.57.4       9.5.5
prometheus-stack     monitoring    1           2023-11-22 15:28:13.290386574 +0100 CET    deployed    prometheus-23.0.0    v2.45.0
Set up Prometheus and Grafana for K8s monitoring
Access Prometheus
Prometheus can be accessed by pointing your browser to the URL http://gl-tor-upc-cp-gw-node1.customer.yyz.gl-hpe.local:10015, extracted by using the following command:
$ kubectl get service/prometheus-stack-server -n monitoring -o jsonpath='{.metadata.annotations.hpecp-internal-gateway/80}'
gl-tor-upc-cp-gw-node1.customer.yyz.gl-hpe.local:10015
You can execute the query in Prometheus by using some metrics, e.g., node_procs_running:

Access Grafana
Grafana can be accessed by pointing your browser to the URL http://gl-tor-upc-cp-gw-node1.customer.yyz.gl-hpe.local:10016. The URL and the admin password can be extracted by using the following commands:
$ kubectl get service/grafana-dashboard -n monitoring -o jsonpath='{.metadata.annotations.hpecp-internal-gateway/80}'
gl-tor-upc-cp-gw-node1.customer.yyz.gl-hpe.local:10016

$ kubectl get secrets -n monitoring grafana-dashboard -o jsonpath='{.data.admin-password}' | base64 -d
cs3O6LF2H9m0jLrgdR8UXplmZG22d9Co9WbnJNzx

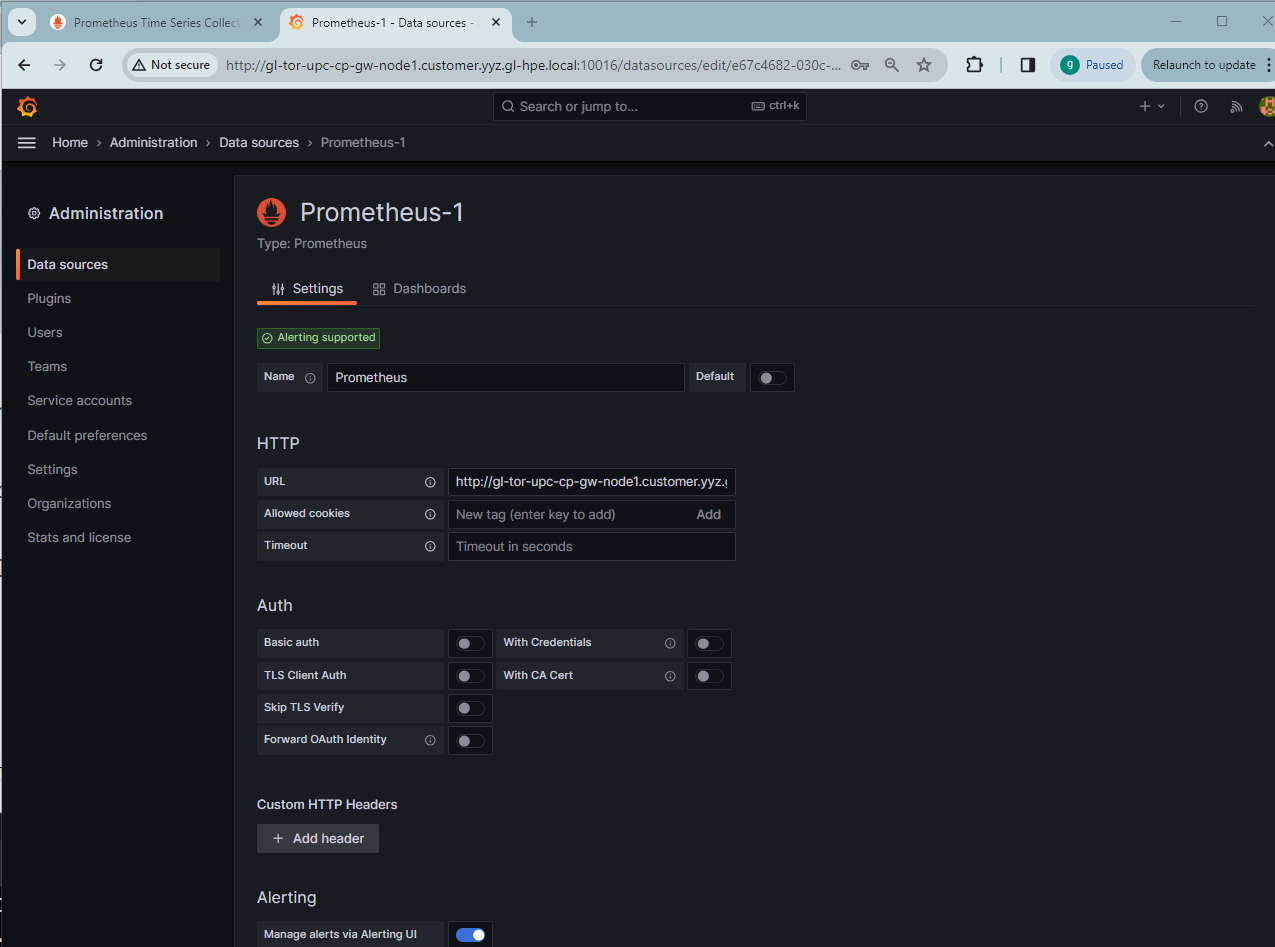
Configure Grafana data sources
From the Grafana Administration page, Prometheus can be configured as the data source by specifying the HTTP URL as http://gl-tor-upc-cp-gw-node1.customer.yyz.gl-hpe.local:10015/:
Import Grafana dashboards
From Grafana Labs, there is a list of Grafana dashboard templates you can download and then import as monitoring dashboards to the Grafana.

Here is the imported dashboard for K8s cluster monitoring (via Prometheus). It shows overall cluster CPU / Memory / Filesystem usage.

Here is another imported dashboard for K8s Pod metrics. It shows individual Pod CPU / memory usage.

Summary
This blog post described the detailed process to deploy and set up Prometheus and Grafana as a monitoring stack in a K8s cluster in HPE GreenLake for Private Cloud Enterprise. Prometheus excels at collecting and storing time-series data, enabling developers to monitor various aspects of K8s, including metrics, performance, and health. Grafana complements Prometheus by providing developers with intuitive dashboards and visualizations, enabling them to gain meaningful insights into K8s performance and behavior. Integration of Prometheus and Grafana by deploying them in the K8s cluster adds a monitoring stack. It empowers users to gain a deep understanding of the cluster’s internal states and behaviors, enabling them to identify potential issues, optimize performance and enhance overall reliability.
Please keep coming back to the HPE Developer Community blog to learn more about HPE GreenLake for Private Cloud Enterprise.
Tags
Related

Discover the power of data center monitoring using Redfish telemetry and cloud-native tooling
Oct 5, 2023Handling application performance monitoring on HPE GreenLake for Private Cloud Enterprise – Part 1: A tools overview
Jan 9, 2023
Open source monitoring at the HPE Customer Technology Center Böblingen
Jan 2, 2024Discover the power of data center monitoring using Redfish telemetry and cloud-native tooling: Part 2 - Streaming
Dec 1, 2023
How to Set Up an Automation Pipeline to View Historical Trend Data of Clusters with HPE GreenLake for Private Cloud Enterprise
Jun 9, 2022
Accessing HPE Ezmeral Data Fabric Object Storage from Spring Boot S3 Micro Service deployed in K3s cluster
Sep 13, 2021
Deep Learning Model Training – A First-Time User’s Experience with Determined - Part 1
Apr 14, 2022