How to Set Up an Automation Pipeline to View Historical Trend Data of Clusters with HPE GreenLake for Private Cloud Enterprise
June 9, 2022Editor’s Note – NAME CHANGE: HPE GreenLake for Containers is now part of HPE GreenLake for Private Cloud Enterprise.
Introduction
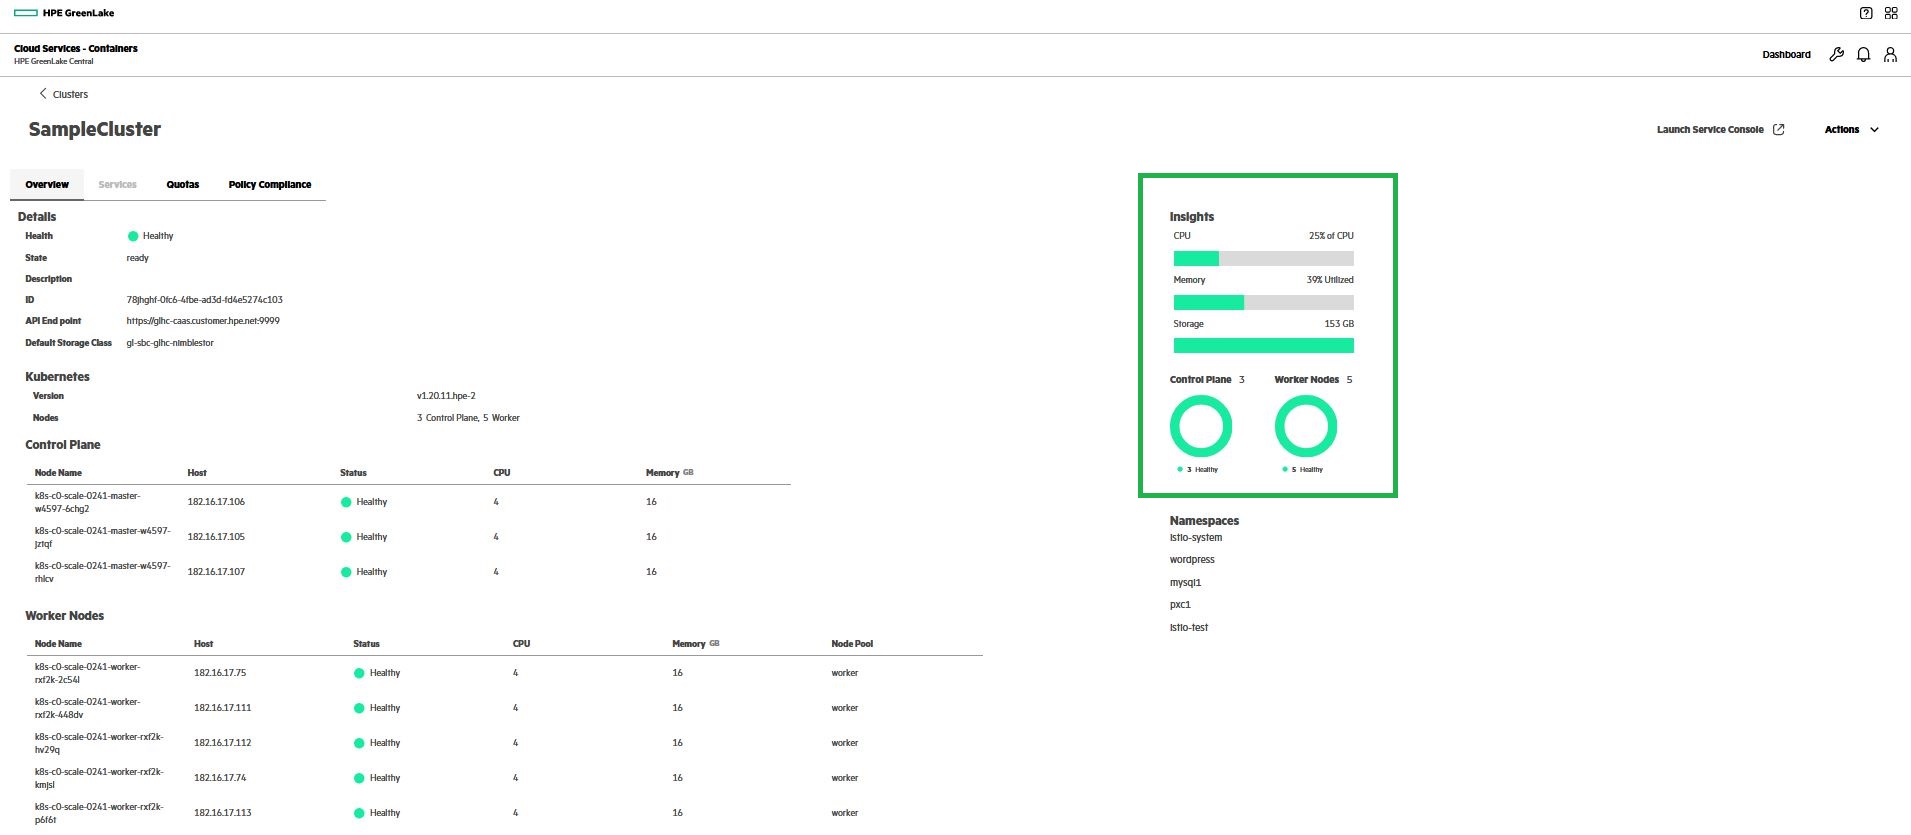
An HPE GreenLake Cloud Service, HPE GreenLake for Containers, is built upon HPE Ezmeral Runtime Enterprise and runs on a container-based Kubernetes orchestrated infrastructure. Using the Clusters module of the HPE GreenLake Central dashboard, one can perform several cluster-related operations. A cluster can be created using default or custom machine blueprints, deleted, scaled up, or scaled-down using this module. Additionally, the cluster detail page provides some interesting insights like CPU usage, memory allocation, and storage availability. It is essential to monitor these types of data so that the resource requirement can be determined without any business impact. The image below illustrates the cluster detail page.

It can be useful to get historical trend data for such metrics to analyze application-specific metrics. Using past consumption data, a customer can decide if the cluster should be scaled up on some days of the year and scaled down on others. For a system administrator working on an abstract layer of application deployment, choosing the right blueprint is crucial. A graph indicating high memory usage over CPU usage might lead him to change blueprints that offer high compute resources. The purpose of this blog post is to illustrate how a person can implement the Automation Pipeline and provide observability via the use of automation tools such as Katalon (UI automation tool), CircleCI (continuous integration and continuous delivery platform), MySQL (a database provider) and Grafana (an interactive visualization web application tool that uses time-series data to create meaningful graphs).
How to Implement the Automation Pipeline?
Kalalon studio software uses an open-source Selenium framework to interact with web browsers with HTTP commands. CI systems can trigger remote execution of Katalon Studio scripts through Docker containers or command-line interfaces. At a scheduled time and frequency, cron jobs can be configured to check various dynamic measurements of clusters such as CPU usage, memory usage, storage capacity availability, the number of worker nodes in the cluster, the number of control planes in the cluster, the time taken to scale up a cluster node, time taken to scale down a cluster node, the time taken to create a cluster, etc.
Katalon Studio provides HTML-based reports or console logs after execution is complete. It is possible to extract the required data in the form of a plain text-based file, such as .csv, using any script. CircleCI offers the capability to export this .csv file as an artifact inside the job. This artifact data can then be imported into the database. In order to visualize the collected data, the Grafana dashboard is helpful. This can be seen in the architecture below.

How to Create a CircleCI pipeline?
A CircleCI pipeline includes various stages such as spinning up the environment by downloading required images and configuring test setup, preparing CircleCI environment, copyright check, cloning repository code, security checking, execution of test scripts, generating artifacts, generating results, and sending out results over email. A cron job schedules the execution of the automation pipeline.
Sample CircleCI config.yaml:
executors:
  katalon8_test_executor:
    docker:
      - image: default/katalon8:latest
jobs:
  checkout-workspace:
    docker:
      - image: circleci/golang:latest
  copyright-check:
    docker:
      - image: copyright-tool
    steps:
      - run:
        name: Check copy right
  cluster-observability:
    executor:
      name: katalon8_test_executor
    steps:
      - run:
          name: "Creating directory for artifacts"
          command: mkdir /tmp/project/
      - run:
          name: "Execute cluster metrics gathering test suite"
          command: xvfb-run katalonc -consoleLog -browserType="Chrome" -retry=0 -statusDelay=15 -testSuitePath="Test Suites/ClusterMetricsSuite" -executionProfile='default' -projectPath='/project/sample.prj' --config -webui.autoUpdateDrivers=true
      - store_test_results:
          path: ./tests/katalon/Reports
      - store_artifacts:
          path: /tmp/project/
workflows:
  cluster-observability:
    triggers:
      - schedule:
          cron: "0 20 * * *"
          filters:
            branches:
              only:
                - master
    jobs:
      - checkout-workspace
      - copyright-check
      - gather-cluster-metrics
          requires:
            - checkout-workspace
      - cluster-scale-operations
          requires:
            - checkout-workspace
      - update-results
          requires:
            - checkout-workspace
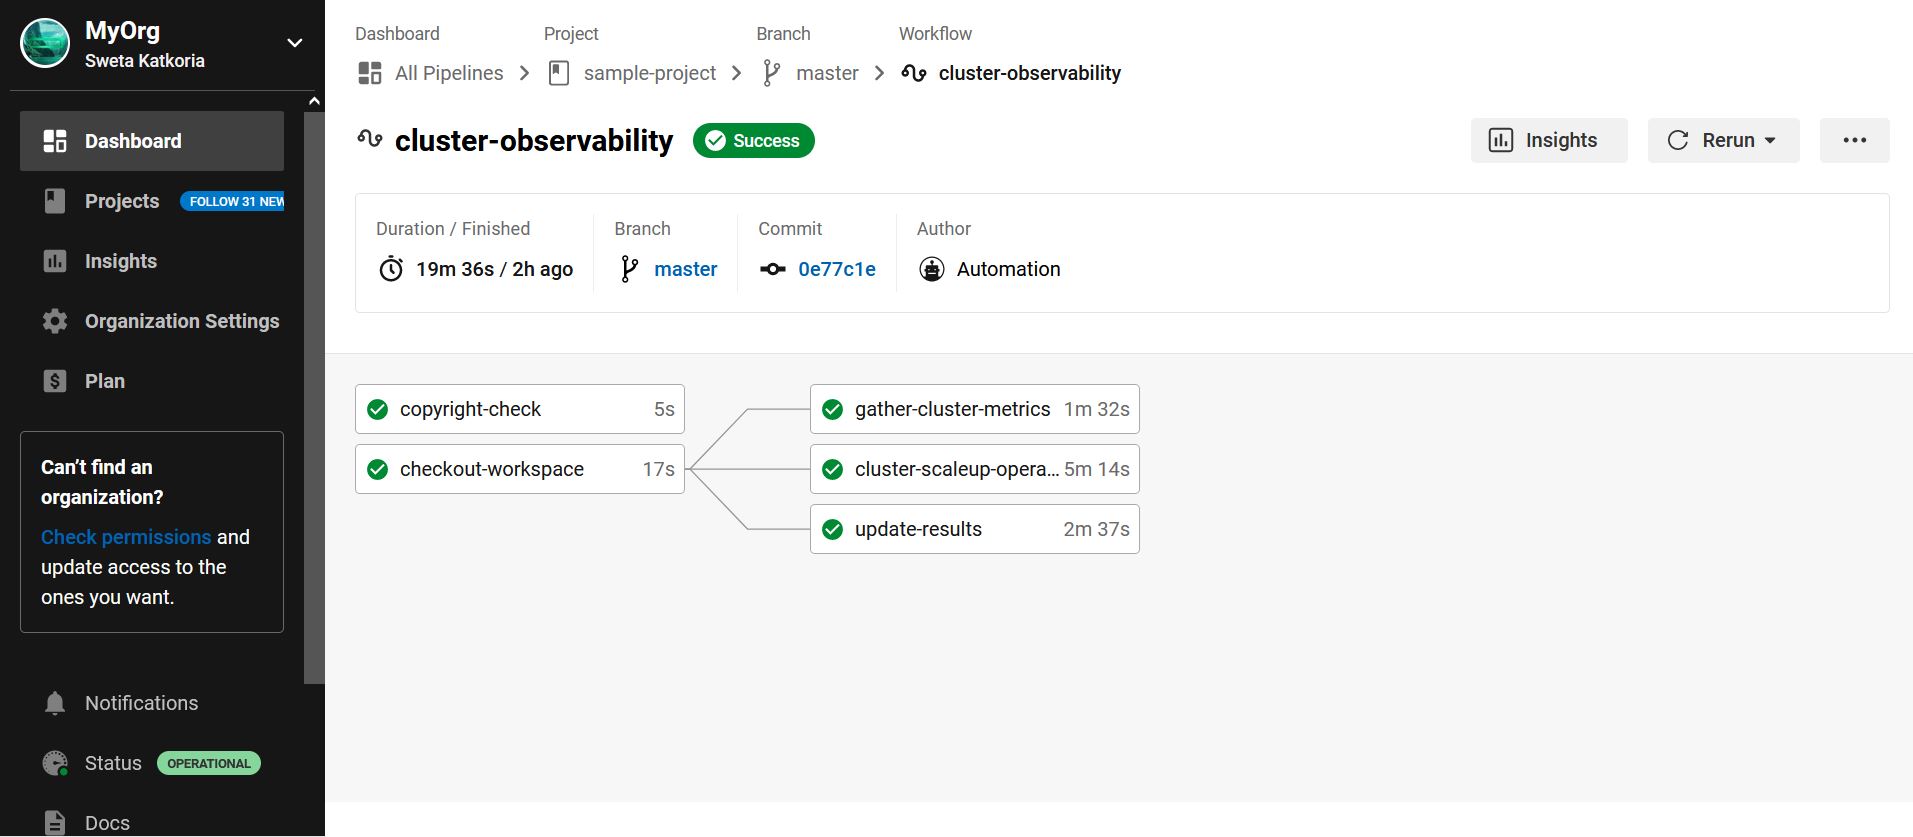
Sample CircleCI workflow can be demonstrated as below:

A csvDataSource.csv artifact file may look like what's shown below:
IDCluster,DateTime,BlueprintType,CPUUsage,MemoryAllocation,StorageCapacity,WorkerNodeCount,ScalingRequired,ClusterScaleUpDuration,ClusterScaleDownDuration,ClusterCreationDuration,ClusterDeletionDuration
2a0810e6-0c32-451b-933b-74fbdf86358a,2022-06-15 20:00:00,standard,50%,70%,5GB,3,N,,,,
ce18d4e0-9af3-40da-8d43-266fe05d17ba,2022-06-16 20:00:00,standard,80%,70%,5GB,3,Y,01,,,
767801bd-7f1e-4a9a-804e-b560f168d968,2022-06-17 20:00:00,standard,10%,10%,5GB,4,Y,,01,,
r3b185d5-c96a-49a5-b6de-13ae93c93fd4,2022-06-18 20:00:00,standard,07%,10%,5GB,2,N,,,,
As illustrated in the above data file, the UI automation run gathers data for the cluster where the application is deployed. A threshold value can be predefined for scaling requirements in the Katalon script. For example, 80% above usage should trigger scaling up, while 10% usage should trigger scaling down. Based on the first record after app deployment, CPU and Memory metrics are 50% and 70%, respectively, for which scaling is not necessary and is marked as 'N' in the data file. The CPU reached 80% usage, on the second day, which means that a scale up operation is required and is marked with 'Y' in the data file. The script for scaling up operation can also record the time it takes to become ready.
How to Download Artifacts from CircleCI Workflow Dynamically?
CircleCI offers API Token to view pipelines via an API interface. Based upon requirements, various APIs can be selected. In the Postman tool, a user can try a combination of APIs for passing the output of one API result to the input of another API. A curl command for downloading artifacts from CircleCI API may look like the one mentioned below:
curl -H "Circle-Token: $TOKEN" "https://circleci.com/api/v2/project/gh/$repo/$project/$JOB_ID/artifacts" | grep -o 'https://[^"]*csvDataSource[^"]*' \
   | wget --timeout=10  --verbose --header "Circle-Token: $TOKEN" --input-file -
Grafana Dashboard Configurations
CircleCI build runs will collect the artifacts and those can be filled into databases like MySQL or Prometheus. In Grafana, various data source configurations are available, where the user has to configure the required data source. There are various chart options available for visual interpretation. By providing various MySQL queries, the required graph can be generated.
A sample MySQL query to display the maximum CPU, Memory, and Storage specific to the cluster name can be written for Grafana, as mentioned below.
select ClusterName AS "Cluster Name",
max(cast(CPU as UNSIGNED)) as "Maximum CPU Usage",
max(cast(CPU as UNSIGNED)) as "Maximum Memory Usage",
max(cast(CPU as UNSIGNED)) as "Maximum Storage Usage",
from ClusterMetricsTable GROUP BY ClusterName;
Finally, the Grafana dashboard appears as:

Note that, all data illustrated is for understanding purposes only. No relevance to actual HPE GreenLake performance is being shown or claimed in this blog post.
Conclusion
Through this blog, users can integrate various tools and generate metrics for observability purpose. And by triggering actions based on these metrics, several objectives can be achieved, such as, selecting the right blueprint for the application or automating cluster scale-up or scale-down operations.
Tags
Related
A guide to enabling a managed Istio service mesh in a Kubernetes cluster on HPE GreenLake for Private Cloud Enterprise
Feb 16, 2023Using HPE GreenLake Console's API Gateway for Data Services Cloud Console
Nov 30, 2021Automate ITOps: announcing foundational APIs for the HPE GreenLake edge-to-cloud platform
Dec 1, 2023
Bare metal provisioning on HPE GreenLake using Terraform
Mar 20, 2023
Bulk onboarding of users in HPE GreenLake edge-to-cloud platform
Apr 24, 2024
Configuring Azure AD as the SAML IDP with HPE Greenlake Cloud Platform and Aruba Central
Jul 11, 2022How to implement a single sign-on solution to authenticate users onto the HPE GreenLake edge-to-cloud platform
Nov 29, 2023