
How to monitor HPE OneView infrastructure with Grafana Metrics Dashboards and InfluxDB
October 12, 2022The purpose of this blog post is to describe how to generate Grafana dashboards using InfluxDB and PowerShell scripts to monitor any HPE Compute infrastructure managed by HPE OneView.
Grafana Dashboards
IT infrastructure metrics visualization is critical for health monitoring, prediction, and capacity planning. It provides a powerful way of viewing infrastructure utilization, revealing issues and helping maintain uninterrupted services.
Grafana’s time-series graphs are the perfect enabler for IT infrastructure optimization. They can assist administrators in monitoring temperature changes, network traffic performance, power consumption, and much more. They can be used to compare data over time to note trends and detect issues, allowing administrators to make any necessary adjustments and prevent downtime.
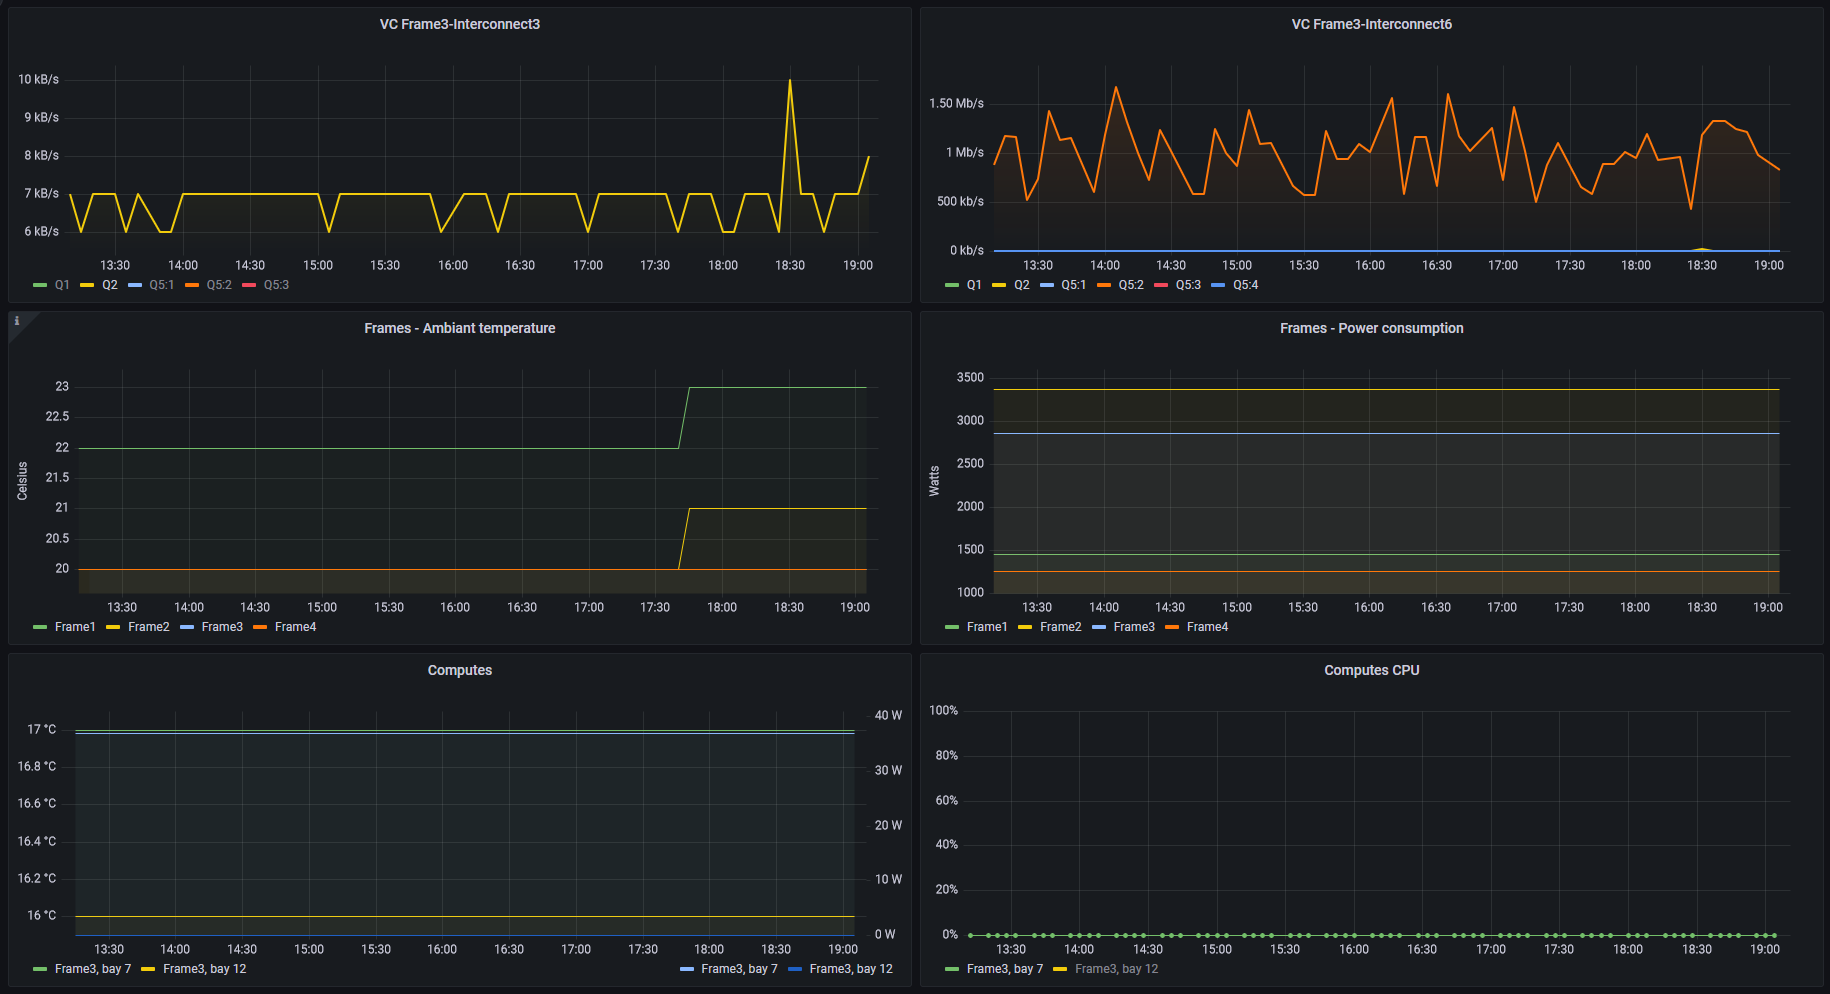
The following picture shows a typical HPE infrastructure dashboard with Synergy frame, compute, and interconnect metrics:
HPE OneView metric resources
Multiple metrics resources are supported by HPE OneView through the API, including CPU, memory, power consumption, temperature, health, capacity data for some resources like enclosures, interconnects and server hardware. Network statistics and network throughput are also available for each uplink and downlink ports in "interconnects" such as HPE Virtual Connect modules.
The following table provides the resource metrics that are accessible through the HPE OneView RESTful API:
Server hardware Metrics | URI |
| Ambient Temperature | /rest/server-hardware/{id}/utilization?fields=AmbientTemperature |
| Cpu Average Frequency | /rest/server-hardware/{id}/utilization?fields=CpuAverageFreq |
| Cpu Utilization | /rest/server-hardware/{id}/utilization?fields=CpuUtilization |
| Average Power | /rest/server-hardware/{id}/utilization?fields=AveragePower |
| Peak Power | /rest/server-hardware/{id}/utilization?fields=PeakPower |
| Power Cap | /rest/server-hardware/{id}/utilization?fields=PowerCap |
Enclosures Metrics | URI |
| Ambient Temperature | /rest/enclosures/{id}/utilization?fields=AmbientTemperature |
| Average Power | /rest/enclosures/{id}/utilization?fields=AveragePower |
| Peak Power | /rest/enclosures/{id}/utilization?fields=PeakPower |
Interconnect Metrics | URI |
| Statistics for the specified port name on an interconnect | /rest/interconnects/{id}/statistics/portname |
| Interconnect cpu and memory utilization data | /rest/interconnects/{id}/utilization |
HPE OneView metrics are enabled by default. For HPE Virtual Connect network statistics, the Utilization Sampling settings defined in the logical interconnect group controls the data collection rate and sample interval value. By default, the HPE Virtual Connect module sampling rate is 12 samples per hour, as shown in the following figure:

InfluxDB Time-series database
My decision to use InfluxDB with Grafana metrics dashboards to monitor HPE OneView infrastructure was made for several reasons. First, InfluxDB can be installed on both Microsoft Windows and Linux, it is an open-source tool, and many useful modules are available to create entries in a database. Other options include Prometheus, which can also be used to collect and record measurements in real time.
To collect HPE OneView metrics, I use a PowerShell script. This script collects utilization statistics of defined resources from the HPE OneView API periodically and continually transmits the metrics to InfluxDB via its REST API. The timestamped metrics data is saved into the InfluxDB time series database that Grafana uses to generate the graphs.
The script is an independent process that must run continuously.
The following diagram describes the different components of the solution:

Pros and Cons about this solution
As with any solution, there are both Pros and Cons to using it.
Pros:
- Enables time-series graphs for the HPE OneView Server hardware utilization statistics and HPE Virtual Connect modules utilization statistics
- Supports collecting metrics from any API (simply requires the appropriate PowerShell script for the collection)
- Provides a flexible solution using widely used and cross-platform scripting language
- Cross-platform support, all components can be installed on Microsoft Windows or Linux
Cons:
- Requires development of PowerShell scripts if the examples provided do not meet your needs
- Requires in-depth knowledge of the language, API, authentication, and methods
Configuration
Prerequisites
- Grafana and InfluxDB must be installed, started, and enabled
- A firewall rule must be created to allow TCP port 8086 (used by InfluxDB API, by default)
- PowerShell Core for Linux must be installed if a Linux server is used to run the PowerShell scripts
- HPE OneView PowerShell library 6.60 or later must be used
Configure InfluxDB http authentication
By default, all security features are disabled in InfluxDB, so it is recommended to set up authentication by creating an admin user.
To launch the influx command line interface (CLI), type:
>influx
Then create a user with an authentication password:
>CREATE USER admin WITH PASSWORD 'P@ssw0rd' WITH ALL PRIVILEGES
Once created, authenticate using:
>auth
username: admin
password: ********
To enable the http authentication, you need to modify the InfluxDB configuration file. Go to the [http] section of /etc/influxdb/influxdb.conf and change the auth-enabled value to true.
[http]
auth-enabled = true
Once modified, restart the InfluxDB service:
>sudo systemctl restart influxdb
PowerShell scripts for HPE OneView metrics collection
PowerShell scripts to collect metrics from the HPE OneView API can be found in my GitHub repository here.
Two distinct scripts are available, one for the interconnect metrics and one for compute, enclosure, and server profile metrics.

For each script, it is important to provide all the required variables for HPE OneView and InfluxDB.

For Grafana-Interconnect-monitoring.ps1, at the beginning of the script you need to provide the interconnect module names and port IDs that you would like to monitor using a hash table format:
Note that the interconnect modules and port names can be found in the HPE OneView UI (in the Interconnects menu):

For Grafana-Server_Enclosure-monitoring.ps1, you need to provide at the beginning of the script, the resource names (server hardware or server profile or enclosure) and utilization (CPU, power, or temperature) that you want to monitor using a hash table format:

The names of the resources that need to be provided can be easily identified in the corresponding menus of the HPE OneView user interface.
These scripts are written to collect metrics continually. They can be run in background on a Linux system using a crontab configuration or on a Microsoft Windows one, using Task Scheduler.
How to run the scripts on a Microsoft Windows machine?
The following commands can be used to schedule both jobs on a Microsoft Windows machine:
>$trigger = New-JobTrigger -AtStartup -RandomDelay 00:00:30
>Register-ScheduledJob -Trigger $trigger -FilePath "...\Grafana-Server_Enclosure-monitoring.ps1" -Name GrafanaServerEnclosureMonitoring
>Register-ScheduledJob -Trigger $trigger -FilePath "...\Grafana-Interconnect-monitoring.ps1" -Name GrafanaInterconnectMonitoring
You can check the job schedule by typing:
>Get-ScheduledJob

Alternatively, launch Windows Task Scheduler, by pressing Windows + R keys on your keyboard to run a command, and enter:
>taskschd.msc

As I am using an "at startup" trigger, it is required to restart the server in order to run the scripts.
Restart the server and confirm that scripts are executed. Once restarted, you can run on a Microsoft Windows machine:
>Get-job

How to run the scripts on a Linux machine?
PowerShell can be installed on different Linux distributions today and it works perfectly, using a crontab configuration would make the scripts run in background. This allows using only one Linux machine to host all components (i.e., Grafana, InfluxDB and the execution of the PowerShell scripts).
To learn more, you can refer to this article.
The Linux repositories proposed by Microsoft can be found here.

On a RHEL/CentOS virtual machine, you can use the following steps:
- Add the Microsoft package repository:
>curl https://packages.microsoft.com/config/centos/8/prod.repo | sudo tee /etc/yum.repos.d/microsoft.repo - Run the PowerShell installation:
>yum install powershell - Copy the script files to the Linux system and set the execution permission on both files:
>chmod +x Grafana-Interconnect-monitoring.ps1
>chmod +x Grafana-Server_Enclosure-monitoring.ps1 - Open the crontab configuration:
>crontab -e - Add two configurations, one for each script with a startup execution after a sleep time:
- @reboot sleep 30 && pwsh -File ".../Grafana-Interconnect-monitoring.ps1"
- @reboot sleep 30 && pwsh -File ".../Grafana-Server_Enclosure-monitoring.ps1"
- Restart the Linux machine to trigger the execution:
>shutdown -r now
How to ensure that the scripts have started successfully?
First, to make sure that the scripts have started, you can check that the databases have been created using the InfluxDB tool.
Connect to the server running InfluxDB and launch the InfluxDB CLI:
>influx
Authenticate using your InfluxDB credentials:
>auth
Display existing databases:
>show databases
If both databases defined in the script are listed, then both scripts have started successfully:

To verify that the metrics are successfully collected, open one of the databases and check the data content as shown below:
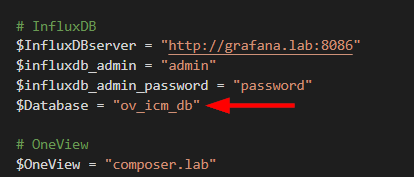
>use ov_icm_db
>show measurements

The measurements listed here correspond to the metrics (ports or resources) defined in the PowerShell scripts.
Open one of the measurements to verify that the metric data is coming in:
>SELECT * FROM "Frame3-Interconnect3-Q1"

The data shows that the collection of metrics has started and that everything is running fine.
Adding InfluxDB data sources in Grafana
Now that InfluxDB is configured and the data is collected, you can add the databases (created by the two scripts) to Grafana as new InfluxDB data sources.
Once that is completed, any dashboard you create in Grafana will have access to the metric data collected.
To launch the Grafana IU, open your web browser and navigate to http://<grafana_IP or DNS name>:3000/
Note: The default HTTP port that Grafana listens to is 3000 unless you have configured a different port.
Click on the gear icon on the side menu and click Add data Sources.

Select InfluxDB from the data source list.

For server and enclosure metrics, enter a data source name, e.g., InfluxDB-OV-Server-Metrics
Add the InfluxDB URL; by default it is http://localhost:8086
Add the database name that you defined in Grafana-Server_Enclosure-monitoring.ps1

Provide the InfluxDB admin username and password.
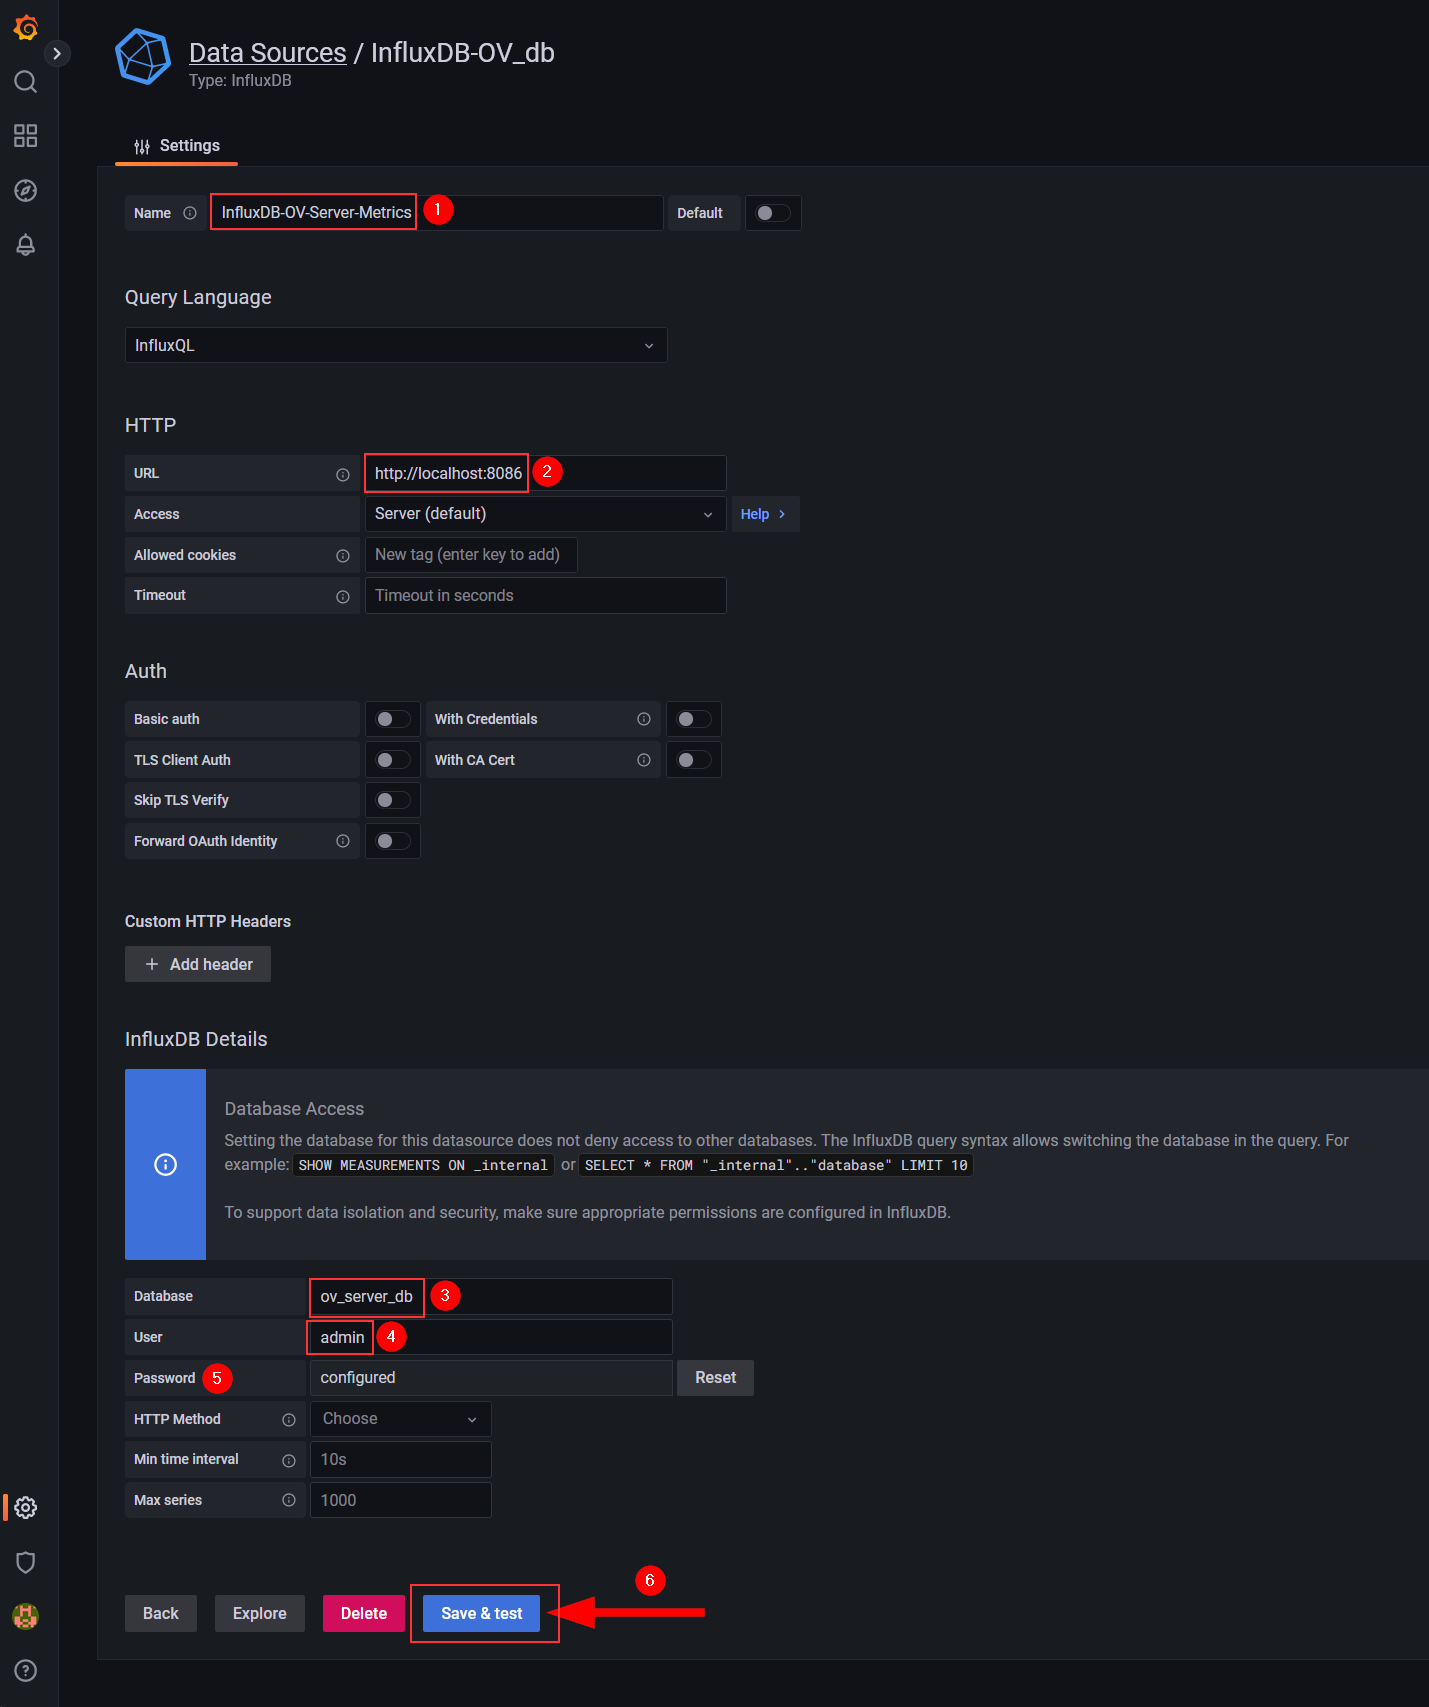
Once completed, click on the Save & Test button.
If no error is returned, a "Data source is working" message is displayed.

Now repeat the same Add data source procedure for the Interconnect metrics, this time using the data source name InfluxDB-OV-Interconnect-Metrics

Again, using the database name you defined in Grafana-Interconnect-monitoring.ps1
Once this is done, click on the Save & Test button and make sure the data source is working.

You can then click on the Back button to return to the Data sources configuration window.
You should now have two new Grafana data sources corresponding to the two InfluxDB databases generated by the two PowerShell scripts.

This completes the configuration of the Grafana data source.
You are now ready to access your InfluxDB time series databases in Grafana.
Creating the Grafana dashboard
A Grafana dashboard can aggregate one or more panels using multiple sources. Thus, you can create a single dashboard with server/enclosure and interconnect metrics panels.
Click on the Dashboards icon on the side menu and click New dashboard.

Click on Add a new panel to create a panel to visualize the first HPE Virtual Connect module metrics.
In Data source, select Influxdb-OV-Interconnect-Metrics

For Query options, it is recommended to set 5m as the minimum query interval to match the HPE OneView API metrics sampling value of the interconnect interfaces (see below).

Then, you need to define a query for each port you specified in the PowerShell script (in the $Ports variable) for this interconnect module name, as shown below:

For example, to set the Q1 port, you need to click on select measurement next to FROM:
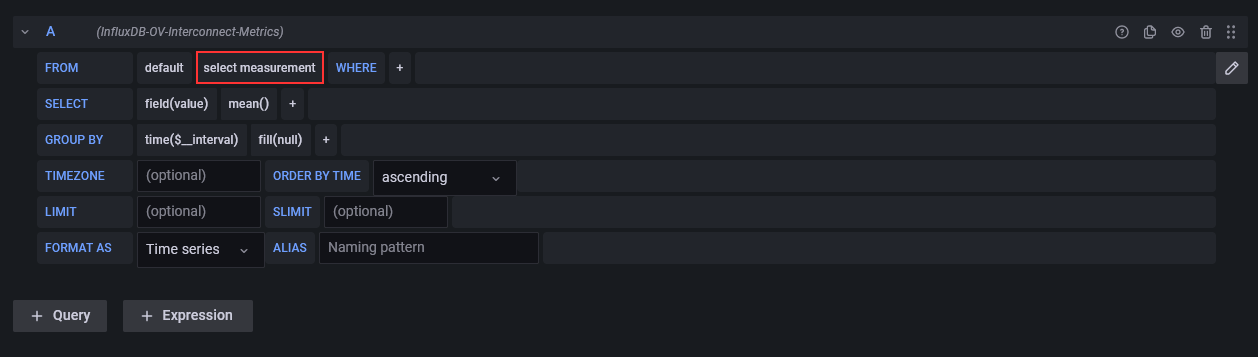
A list of all the measurements available in the database is displayed in the drop-down menu, as seen below:

Select Q1, then click on field (value) in the SELECT row to select the value you want to display:

A list of all measurement values recorded in the database displays in the drop-down menu:

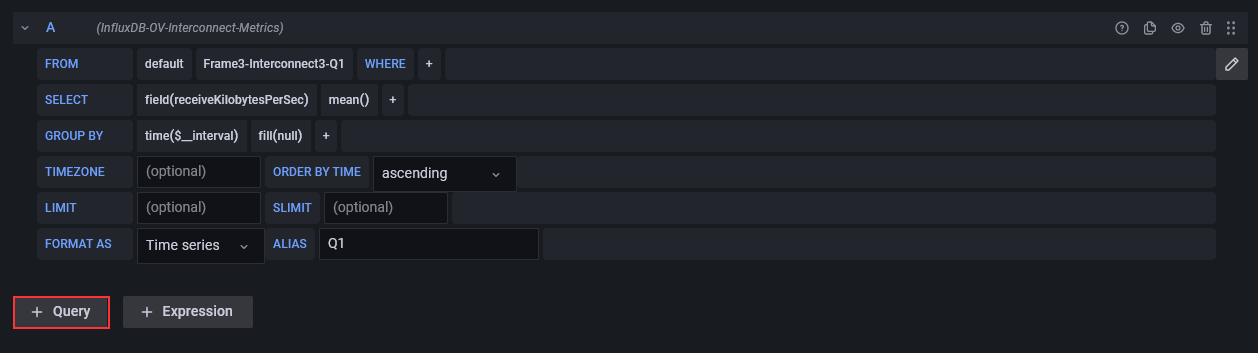
Select receiveKilobytesPerSec for example.
You can then set the alias as Q1 to replace the default metric name and get a clear legend label on the chart.


The metric points should already appear on the graph.
Further, you can specify a panel title in the right-side menu using the interconnect name you selected, like VC Frame3-Interconnect3 (in our example).

And for a better visualization, you can select Always for Connect null values and Never for Show points in the Graph styles section.

And finally, set the unit data rate you selected in the SELECT row. Scroll down to the Standard options section and in Unit , select Data rate and click on kilobytes/sec.

Rendering should display as follows:

This completes the configuration of the first port query.
You will need to click on the + Query button for the other ports and repeat the same query configuration (as previously described) for all the ports defined in the PowerShell script.

Once all queries have been defined, you can save the panel using the Save button in the upper right corner. Type a name for the newly created dashboard like HPE OneView Metrics.

You can now duplicate this panel to create another one for the second HPE Virtual Connect module. Click on the panel's context menu, select More , then Duplicate.
Click on the duplicated panel's context menu then select Edit.
Change the panel title with the name of your second Virtua Connect module like VC Frame3-Interconnect6 Metrics
Then modify each query by selecting the ports on the second interconnect module that you want to monitor.

Click Save then Apply.
The dashboard now displays two panels, one for each HPE Virtual Connect module that was defined in Grafana Interconnect monitoring.ps1

The next step consists in creating panels to display Compute and Frame metrics.
Click on the Add panel button on the upper bar and select Add a new panel.
Select the InfluxDB-OV-Server-Metrics data source, then select the resource you want to monitor.

Select the measurement you need:

Then:
- Add a panel title
- Use 5m for the Min interval query options
- Select the graph styles options
- Connect null values: Always
- Show points: Never
- Select the correct unit corresponding to the measurement type
- Power: Energy / Watt
- Temperature: Temperature / Celsius
- CPU: simply type GHz
- Add meaningful alias names to reflect reported measurement
Add any additional measurement you need, using another query.
Here is an example of a frame panel with power and temperature metrics defined:

For panels with two different types of measurements (Watt and Celsius) as seen above, you need to define two Y-axes. One for the temperature and one for the power consumption.
Select Overrides at the top of the right-side menu, then click on Add field override :

After that, select the following override properties:
- Fields with name: Temperature
- Axis placement: Right
- Standard options > Unit: Energy / Watt (W)

When completed, the panel displays the two Y-axis:

You can then click on Save, then Apply buttons to return to the Grafana dashboard. An additional panel to monitor the temperature and power consumption of a frame is displayed.

Next, you can add as many panels as you have resources defined in your PowerShell scripts.
This concludes this blog post. I hope you find it useful and should you have any feedback, please send me a message.