
How to monitor HPE GreenLake for Compute Ops Management infrastructure with Grafana Metrics Dashboards
October 19, 2022The purpose of this blog post is to describe how to generate Grafana dashboards to monitor any HPE Compute infrastructure managed by HPE GreenLake for Compute Ops Management.
Grafana Dashboards
IT infrastructure metrics visualization is critical for health monitoring, prediction, and capacity planning. It provides a powerful way of viewing infrastructure utilization, revealing issues and helping maintain uninterrupted services.
Grafana’s time-series graphs are the perfect enabler for IT infrastructure optimization. They can assist administrators in monitoring temperature changes, network traffic performance, power consumption, and much more. They can be used to compare data over time to note trends and detect issues, allowing administrators to make any necessary adjustments and prevent downtime.
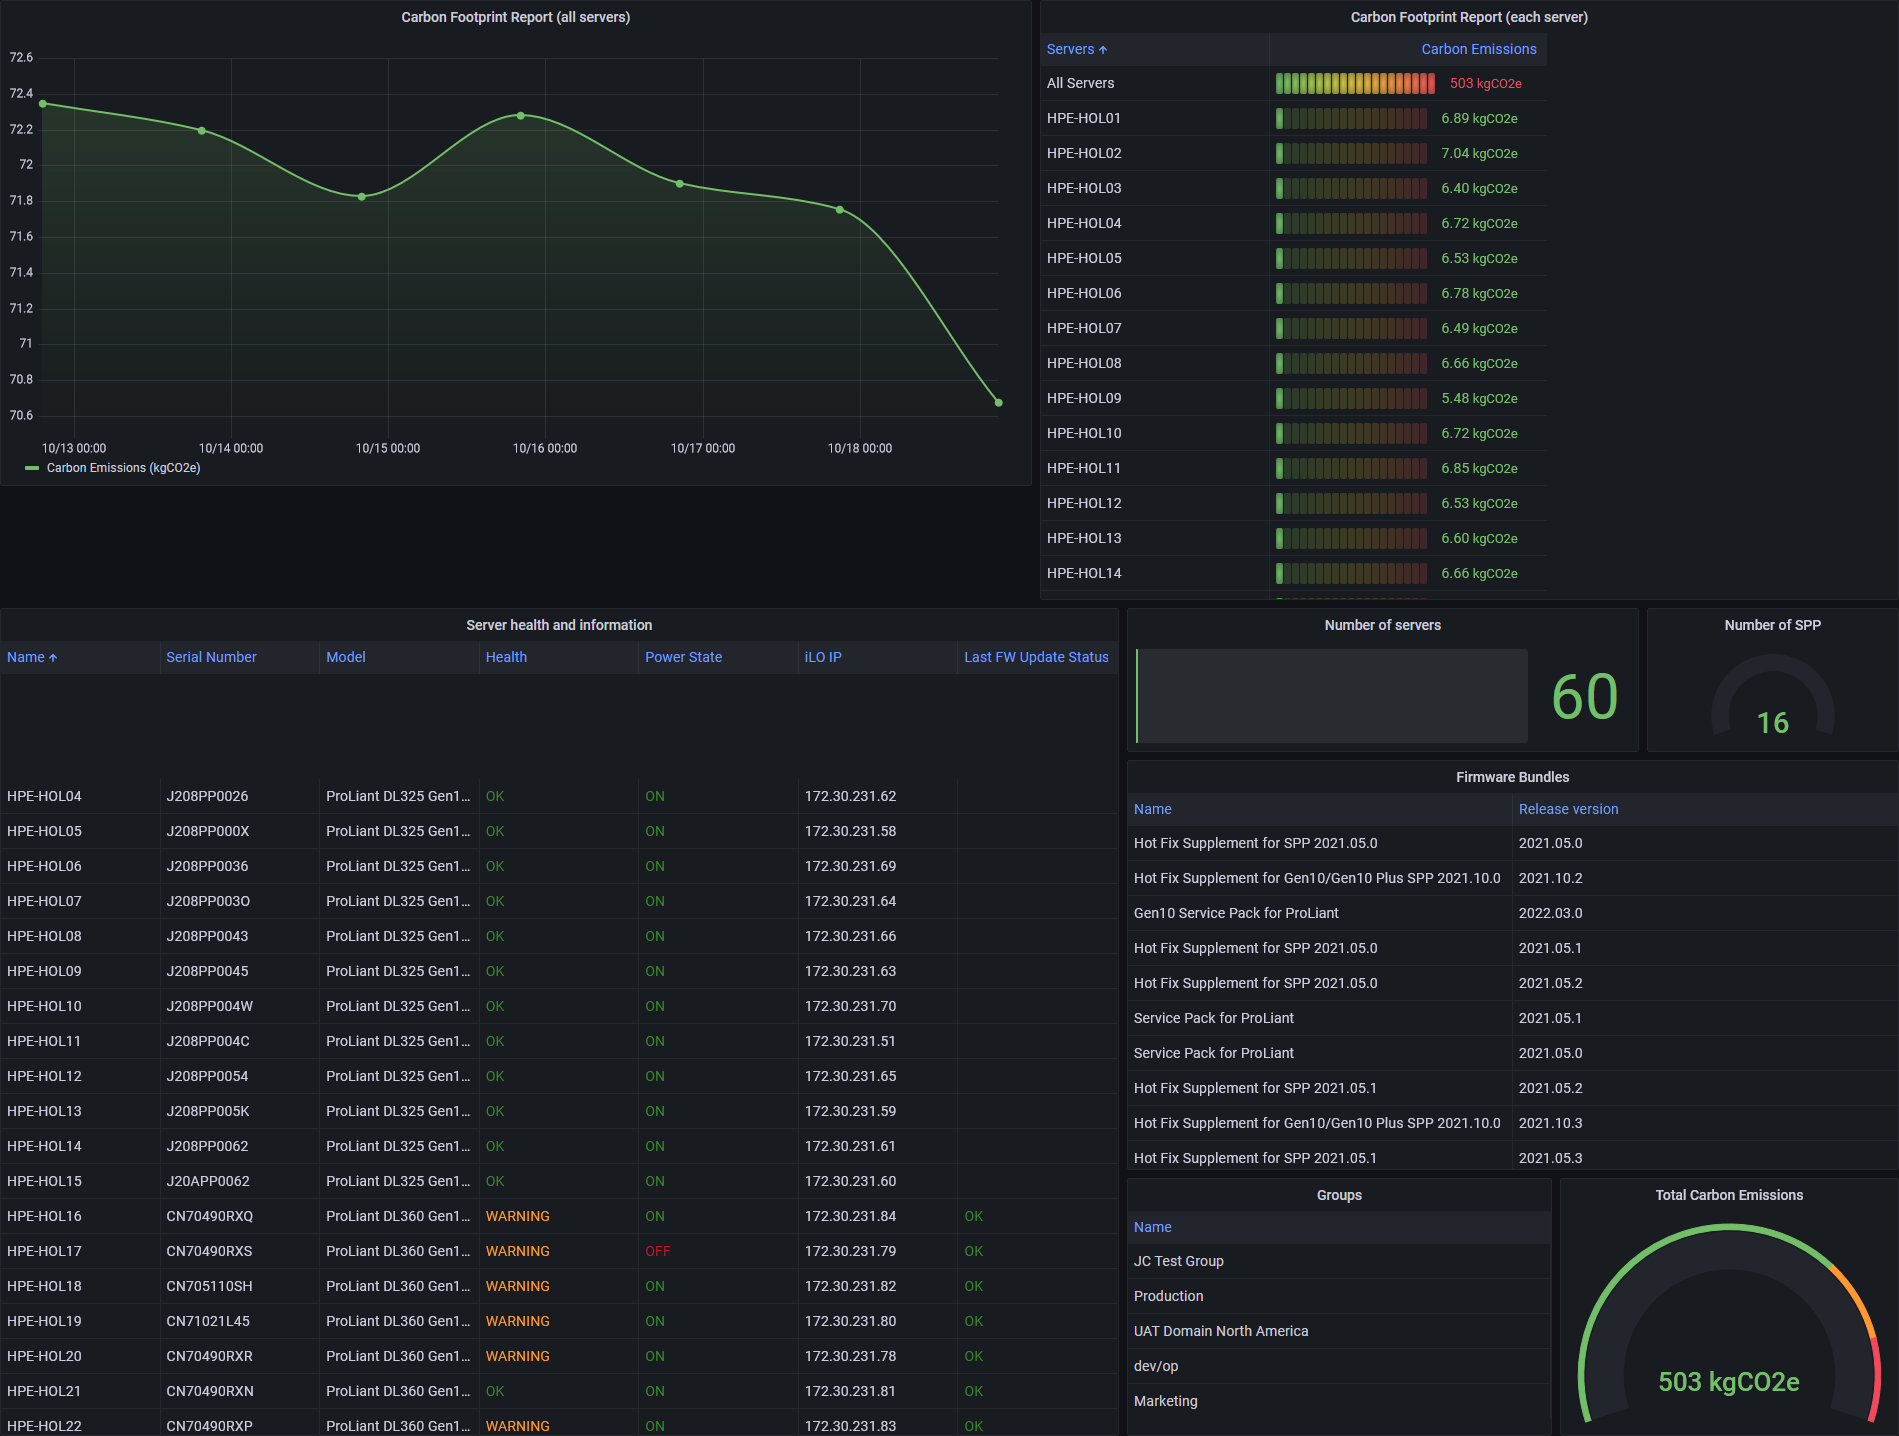
The following picture shows a typical HPE infrastructure dashboard with different panels generated from HPE Compute Ops Management:
HPE GreenLake for Compute Ops Management REST API
HPE GreenLake for Compute Ops Management provides a northbound RESTful API that supports many operations. All the data you can get from the Compute Ops Management API can be leveraged to create beautiful and instructive Grafana dashboards.
To take advantage of this, simply use a generic Grafana plugin that can handle REST requests, parse JSON responses and generate tables. With this solution, we greatly reduce the complexity of the solution which in principle requires a database like Prometheus or InfluxDB. In this post, I will show you how to do it without a database...
HPE GreenLake for Compute Ops Management REST API uses the OAuth 2.0 authentication based on the client credential, which generates a limited lifetime access token.
The access token is a long string in the form of a JSON Web Token that is signed using RS256 algorithm. The access token must be added into the HTTP header with keyword "Authorization: Bearer {token}" for any REST API request.
For information about how to create API client credentials and how to generate an access token for HPE GreenLake for Compute Ops Management, refer to this web page.
Only a few resource metrics are currently supported by Compute Ops Management via the RESTful API, but things will change quickly in the coming months. Today, the only metric available is the carbon footprint report but many other resources are available to create nice Grafana dashboards such as data related to the number of servers, health of servers, service packs, groups, etc.
Grafana Infinity plugin
There are several Grafana plugins that support data collection via the REST API (e.g. Infinity, JSON, JSON API) but Infinity has the great advantage of offering an advanced query language that is essential for manipulating JSON data into a suitable format that Grafana can understand. This language is called UQL, Infinity's unstructured query language.
UQL is not simple at first glance, but I will provide examples in this blog. With UQL, you can customize the results you need regardless of the JSON format returned by the API.
A UQL query can be formed with a list of commands joined by |. Most of the time, fields are referenced in double quotes and string values are referenced in single quotes as shown below:

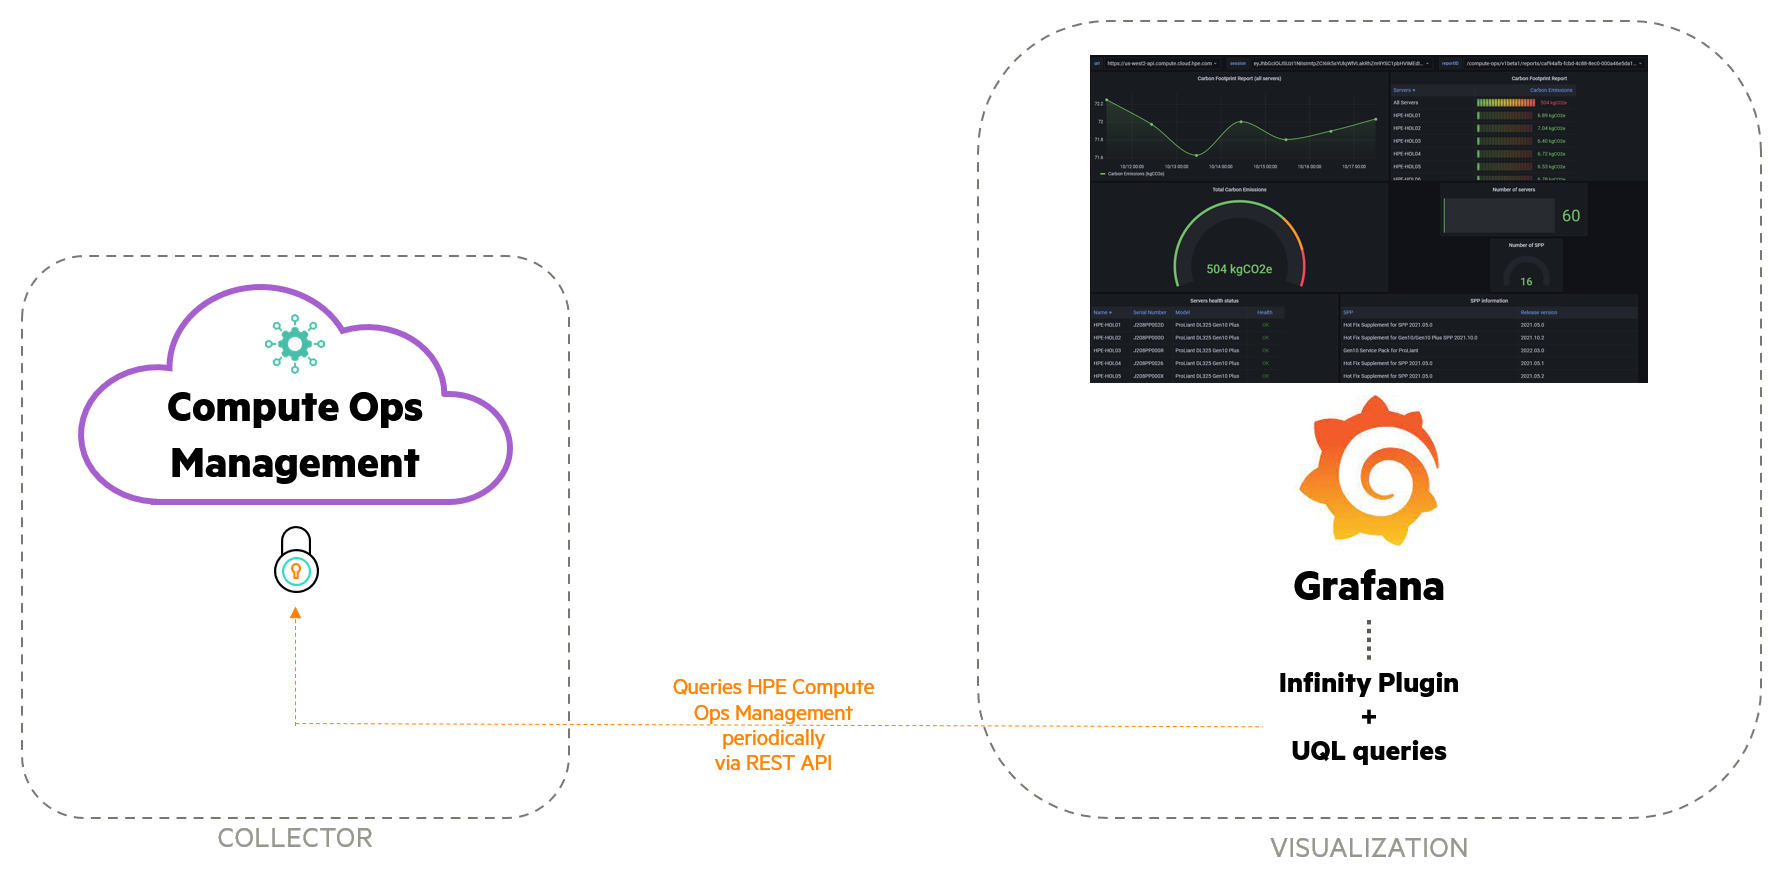
The following diagram describes the different components of the solution:
Pros and Cons about this solution
As with any solution, there are both Pros and Cons to using it.
Pros:
- A lightweight solution that only requires Grafana and an easily installable plugin
- Supports collecting metrics from any API
- Cross-platform support, all components can be installed on Microsoft Windows or Linux
Cons:
- Cannot create a time series Grafana visualization with non-time series data you may retrieve from an API (This would require the use of a database, like Prometheus or InfluxDB)
- Requires in-depth knowledge of the API, authentication, and methods
- Requires knowledge of the UQL language to manipulate JSON data
Configuration
Prerequisites
- Grafana must be installed, started, and enabled
- HPE GreenLake for Compute Ops Management API client credentials are required (this consists of a client ID and a client secret)
Infinity plugin installation
From an SSH session on the Grafana server, enter:
>grafana-cli plugins install yesoreyeram-infinity-datasource
Then restart the Grafana service:
>service grafana-server restart
For more details on how to install the Infinity plugin, you can check out the Infinity GitHub repository.
Grafana configuration
To launch the Grafana User Interface, open a web browser and navigate to http://<grafana_IP or DNS name>:3000/
Note: The default HTTP port that Grafana listens to is 3000 unless you have configured a different port.
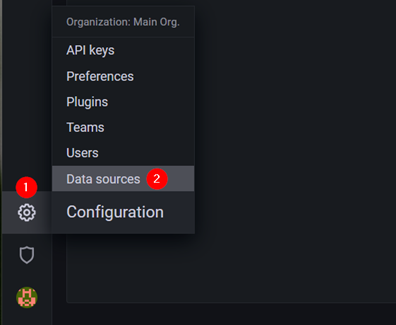
Click on the gear icon on the side menu and click Data Sources.
Search for Infinity from the data source list.
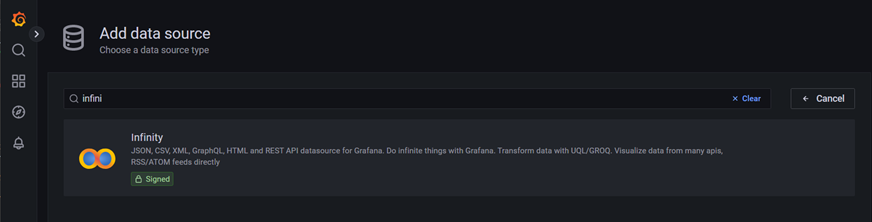
Add Infinity as a new data source and name it Infinity-COM.
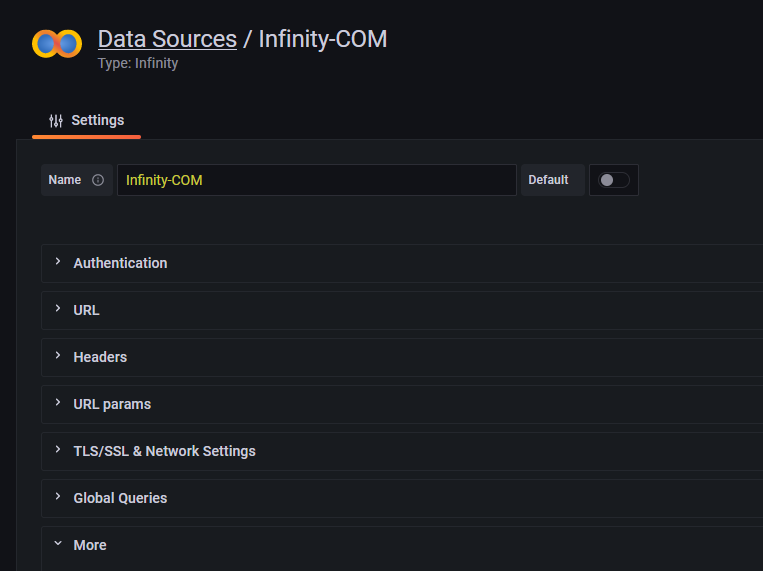
Leave all other settings as default and click Save & test.
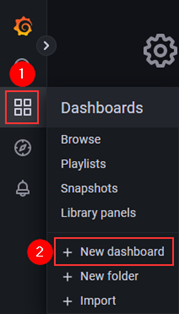
Then to create a new Dashboard, click on the Dashboards icon on the side menu and select New dashboard.
The next steps consist in creating variables and panels for this dashboard. I will describe in this blog each step with a lot of details to give you an overview of the methods I use.
Important note: You have the option to import the dashboard directly from my GitHub repository using the JSON file provided, which contains everything you need (layout, variables, styles, data sources, queries, etc.). Once imported in Grafana, the same dashboard that is described in detail below with its different panels will be immediately available, it includes carbon emissions reports, server information and health, firmware bundles, groups information, etc. Refer to the README.md for more details.
Going back to the manual configuration, the next step is to create Grafana variables for this new dashboard. These will be used to simplify the API authentication process and the REST requests you will define later.
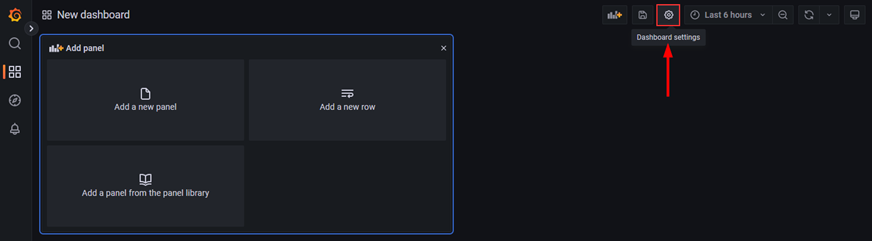
Click on Dashboard settings:
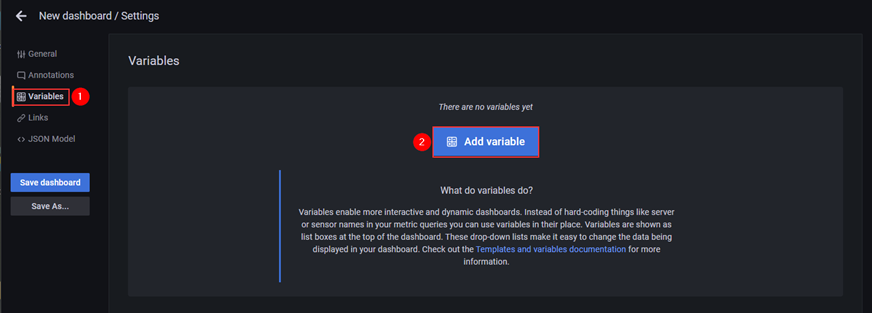
Then select Variables then Add variables:
Three variables are required:
A variable for the HPE GreenLake for Compute Ops Management API endpoint URL:
Endpoints are the host URLs that you will submit your API requests to. Compute Ops Management has unique endpoints in specific regions. Which region is used depends on which region the devices were onboarded into via the HPE GreenLake Cloud Platform.
Use the following list to identify your application endpoint:
- US West: https://us-west2-api.compute.cloud.hpe.com/
- EU Central: https://eu-central1-api.compute.cloud.hpe.com/
- AP NorthEast: https://ap-northeast1-api.compute.cloud.hpe.com/
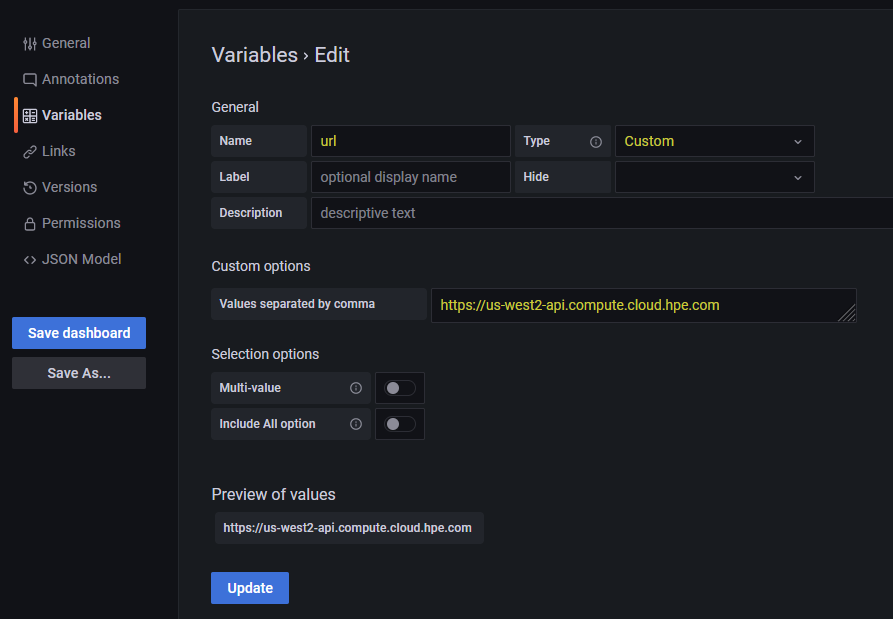
Create a new variable using the following parameters:
- Name: url
- Type: Custom
- Value: <Your endpoint URL>
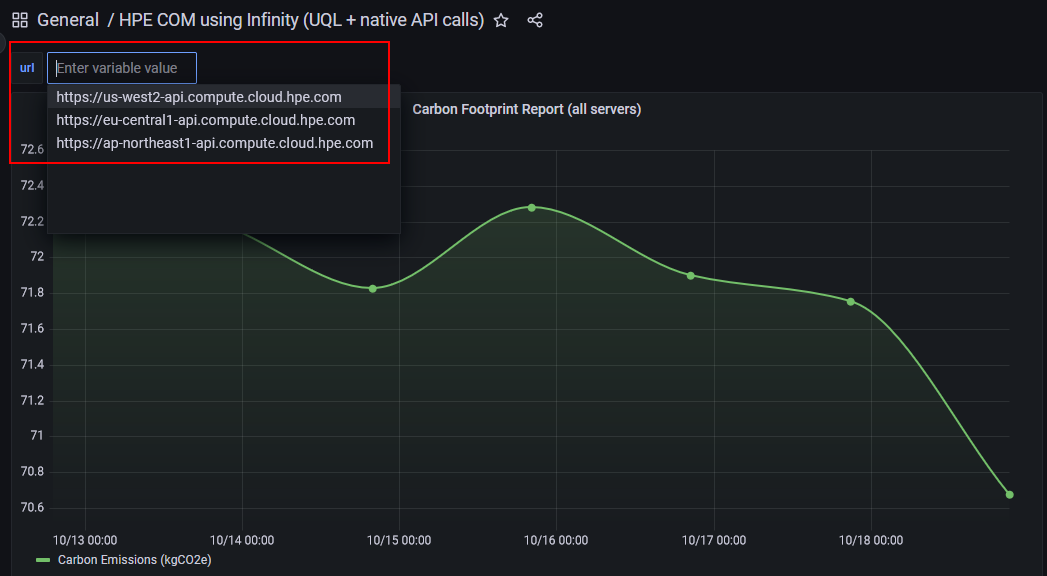
Note: If you have devices in different regions, you can define your variable with the values of the three endpoints separated by a comma.
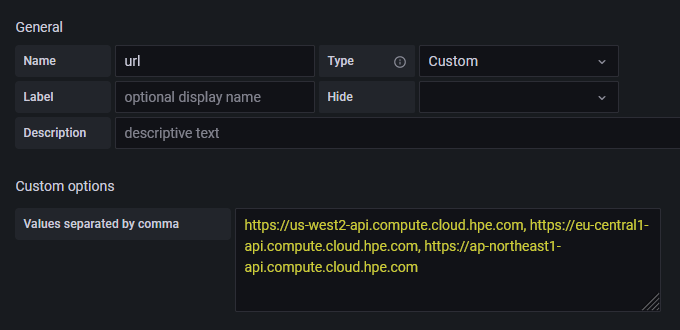
Note: When multiple endpoints values are defined, the url variable is listed in a drop-down list at the top of the dashboard. This is very useful if you want to quickly adjust the visualization of the different regions.
A variable to generate the access token for the API authentication:
Compute Ops Management REST API uses the OAuth 2.0 authentication based on the client credential, which generates a limited lifetime access token. So, the variable must be created using:
- Name: session
- Type: Query
- Hide: Variable
- Data source: Infinity-COM
- Query Type: Infinity
- URL: https://sso.common.cloud.hpe.com/as/token.oauth2
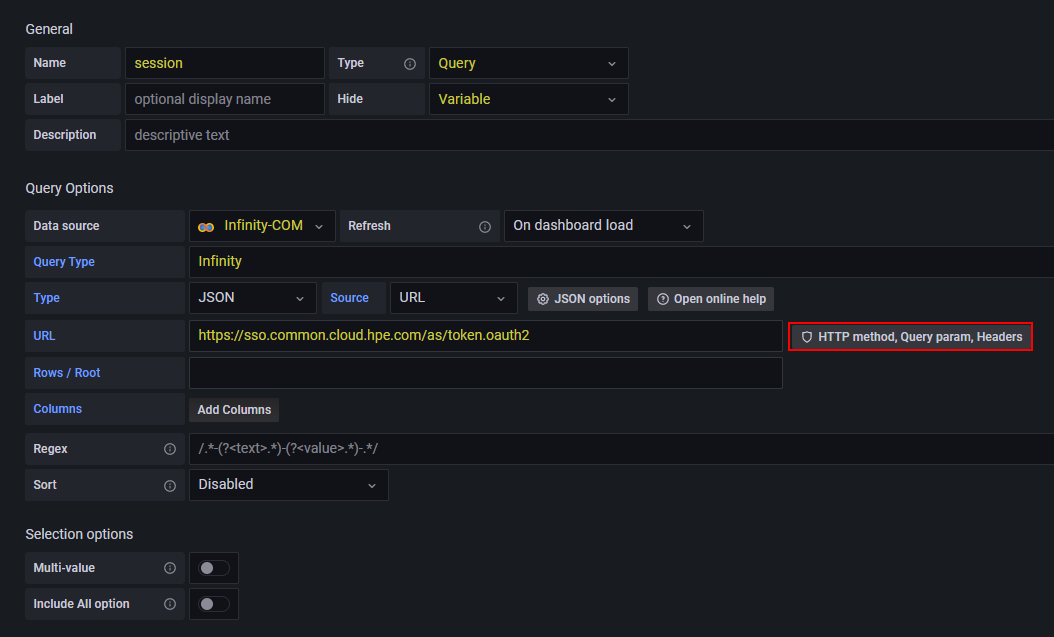
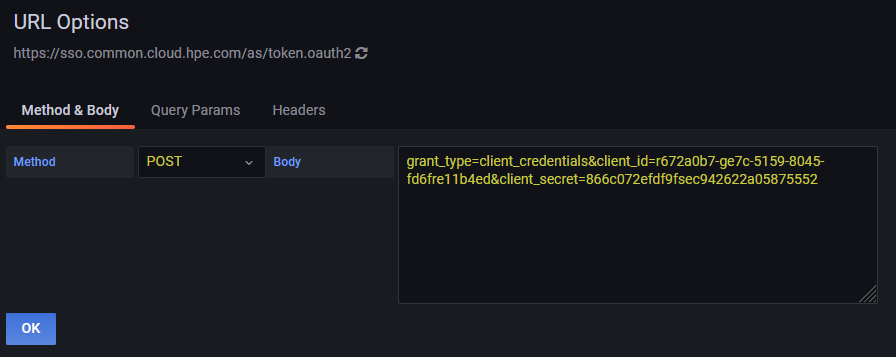
Click then on HTTP method, Query param, Headers and use the following parameters:
- Method: POST
- Body: grant_type=client_credentials&client_id=<your-client-ID>&client_secret=<your-client-secret>
Note: <your-client-ID> and <your-client-secret> are the Compute Ops Management API client credentials generated from the HPE GreenLake Cloud Platform (GLCP).
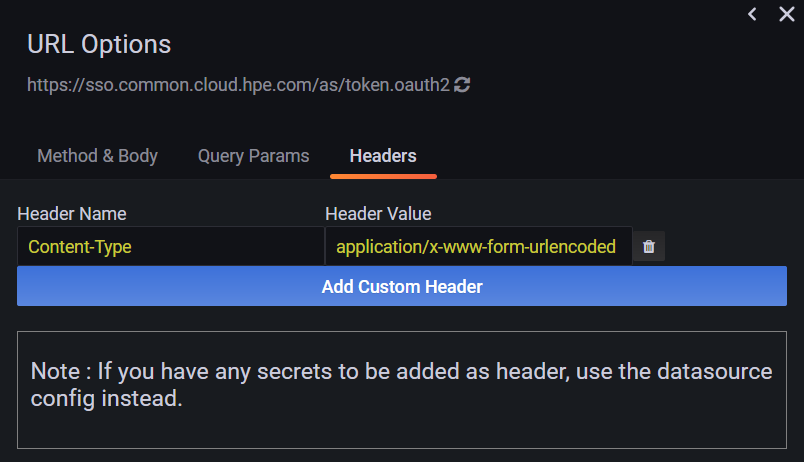
And add in the Headers tab:
- Header Name: Content-type
- Header Value: application/x-www-form-urlencoded
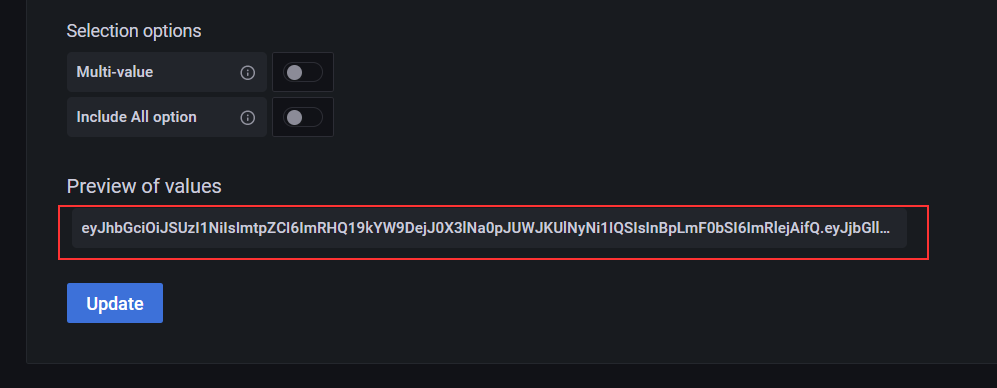
When everything is properly configured, the access token generated by the Compute Ops Management API should be displayed in the Preview of values section at the bottom of the page:
A variable for the carbon footprint report ID:
I use a variable for the carbon footprint report ID, because each time a new report is generated, a new
idis created. So, by using a variable, I can fetch the last reportidand be sure that all my CO2 report API requests will be successful.For this variable, use the following parameters:
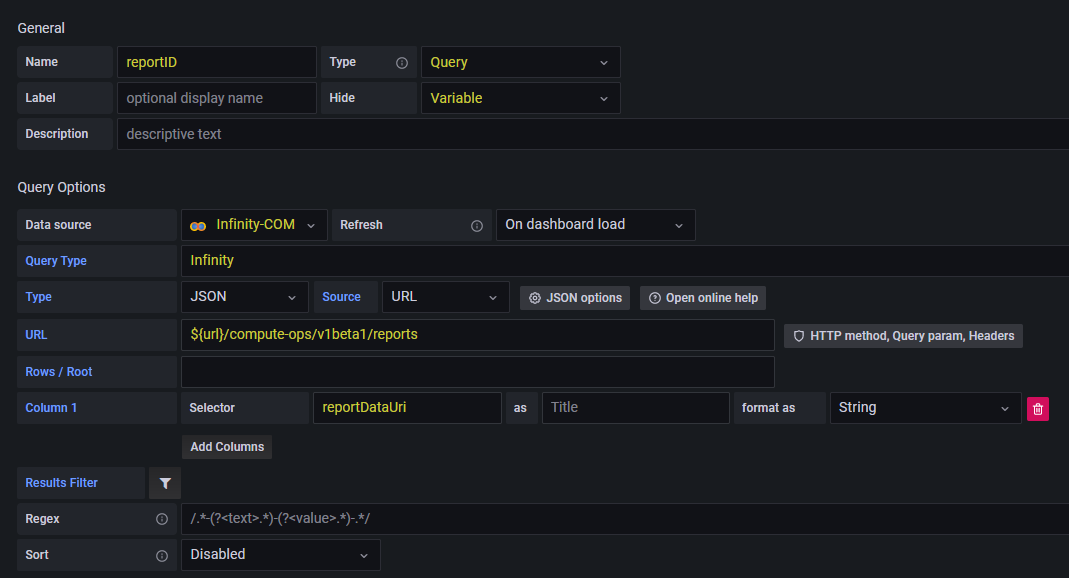
- Name: reportID
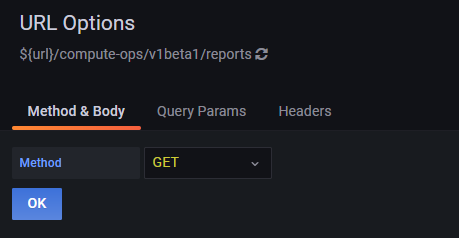
- Type: Query
- Hide: Variable
- Data source: Infinity-COM
- Query Type: Infinity
- URL: ${url}/compute-ops/v1beta1/reports
- Column 1: reportDataUri
Note:
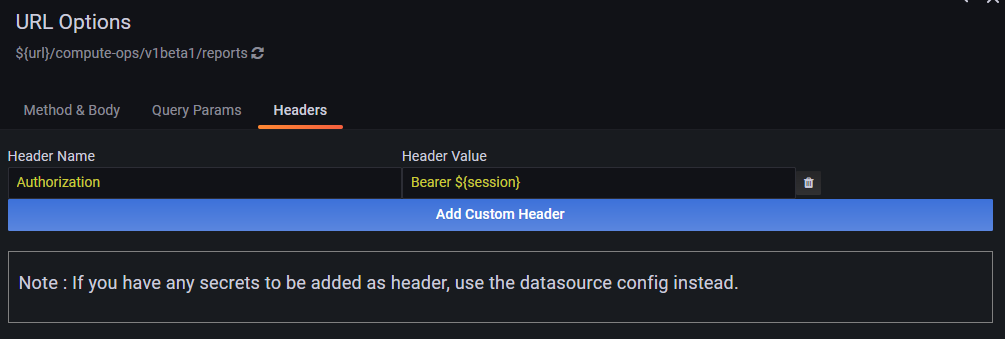
${variablename}is the general syntax for calling a variable in Grafana. So${url}used in the URL field calls the url variable you defined earlier. Same for${session}below in the header value, it calls the access token generated by the API.- Method: GET
- Header Name: Authorization
- Header Value: Bearer ${session}
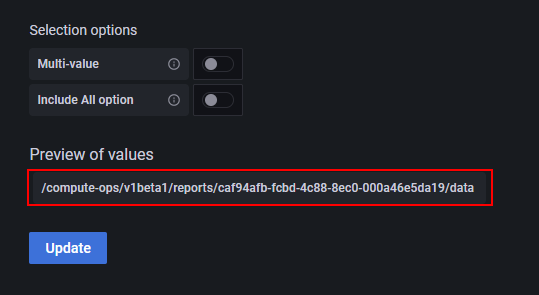
Once completed, the URI of the carbon footprint report should be displayed in the Preview of values section:
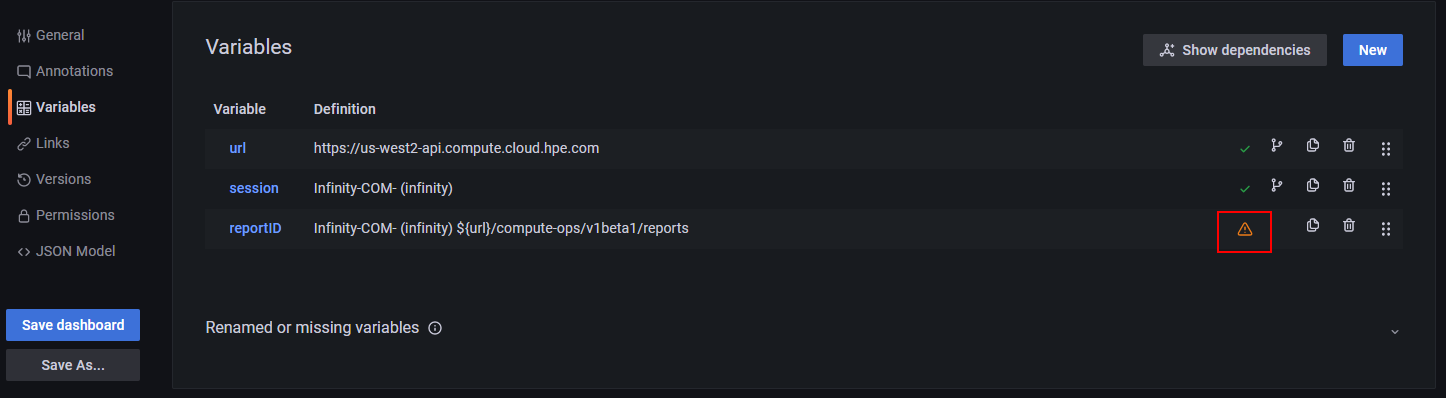
The variables and parameters of the dashboard are now complete. The warning on the reportID variable below is expected because this variable is not yet used by any panel. This will be corrected once reportID is used in a query.
Click on Save dashboard and give it an appropriate name.
Creating Grafana panels
The last step of the configuration is to create panels for this new dashboard.
To create a first panel, click on the Add panel icon in the upper menu bar and click Add a new panel.

The following sections describe different panels you can generate in Grafana with HPE Compute Ops Management. They are provided as examples and the parameters can of course be modified to suit your needs. Each section lists the required parameters, provides API information, and methods and includes the UQL queries (if needed) to transform the JSON data.
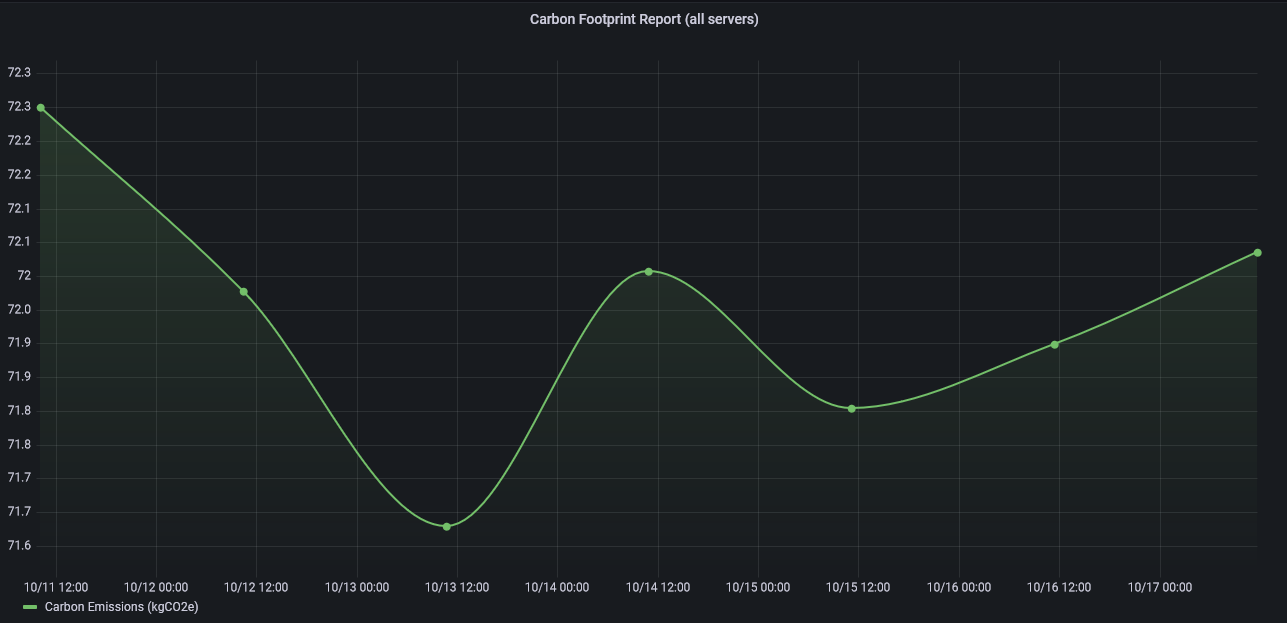
Carbon footprint report (all servers)
Analyzing carbon emissions can help you understand the impact of your servers on the environment. Use the carbon footprint report to view the estimated carbon emissions generated by powering all the servers in a Compute Ops Management application region. The report displays the following information for the past seven days:
- Estimated total carbon emissions for all servers
- Estimated daily carbon emissions for all servers
- Estimated total carbon emissions for each server
The report does not include estimates of the embedded carbon footprint from manufacturing and distribution of the servers.
Important note: Carbon footprint information is only available after running a report from the HPE GreenLake Cloud Platform GUI and, be aware, there is currently no API method to generate a report, so this process can only be manual and via the GUI. The carbon footprint report, when run, collects data from the last seven days and Compute Ops Management only saves the most recent report. As a result, the visualization in Grafana will be limited to seven days prior to the report run date and to get an up-to-date graph, it is necessary to run a new report from the HPE GreenLake GUI.
Panel overview
API request
get /compute-ops/v1beta1/reports/{id}/data
API response
  "id": "843023bd-9412-46c2-8ac2-a3691f657fdb",
  "type": "compute-ops/report-data",
  "name": "Carbon Footprint Report (All Servers)",
  "request": {
    "reportDataStartAt": "2022-02-04T01:04:20+00:00",
    "reportDataEndAt": "2022-02-11T01:04:20+00:00",
    "reportType": "CARBON_FOOTPRINT"
  },
  "series": [
    {
      "name": "Carbon Emissions",
      "type": "CO2_EMISSIONS",
      "units": "kgCO2e",
      "unitsDisplayName": "kilograms of carbon dioxide equivalent",
      "subject": {
        "displayName": "1M512501AB",
        "id": "875765-S01+1M512501AB",
        "type": "SERVER"
      },
      "summary": {
        "avg": 6.4,
        "sum": 6.4
      },
      "bucketDurationInSec": 86961.3,
      "expectedSamplesPerBucket": 289.9,
      "buckets": [
        {
          "timestamp": "2019-08-24T14:15:22Z",
          "value": 6.4,
          "numSamples": 233,
          "noValueReason": null,
          "extrapolated": 8
        }
      ]
    }
  ]
}
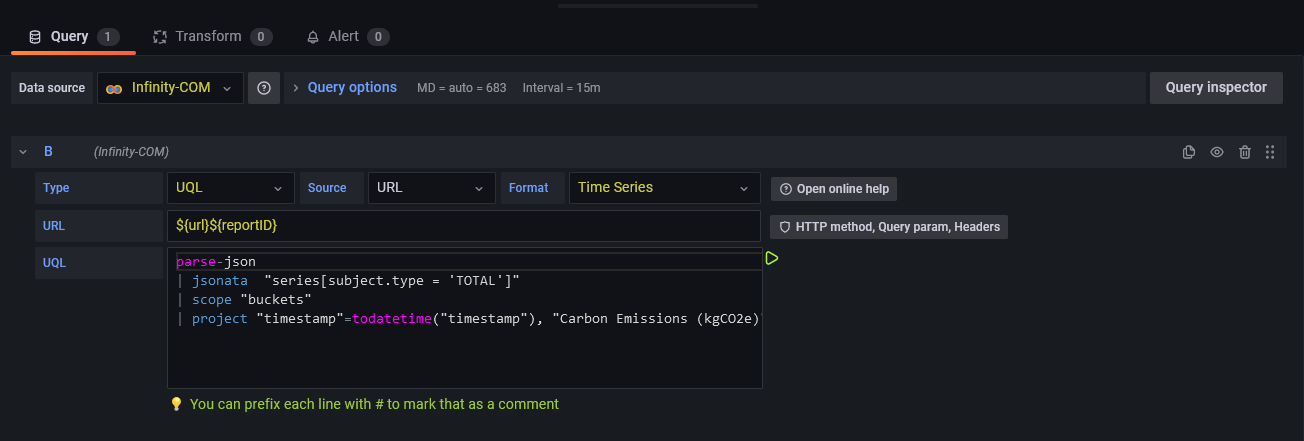
Panel configuration
- Data source: Infinity-COM
- Type: UQL
- Format: Time Series
- URL: ${url}${reportID}
- Method: GET
- Header name: Authorization
- Header value = Bearer ${session}
UQL:
parse-json
| jsonata "series[subject.type = 'TOTAL']"
| scope "buckets"
| project "Timestamp"=todatetime("timestamp"), "Carbon Emissions (kgCO2e)"="value"Description of the UQL commands:
- parse-json: command to instruct UQL to parse the response as JSON
- jsonata: command to select the object representing the carbon emission report for all servers available in the
seriesarray - scope: command to set
bucketsas the output data - project: command to create a table with two columns (Timestamp and Carbon Emissions (kgCO2e))
Note: JSONata is an open-source expression language that is used for querying and transforming JSON data. You can refer to the following JSONata Cheatsheet for tons of examples on how to manipulate JSON data.
Visualization: Time Series
- Unit: Number
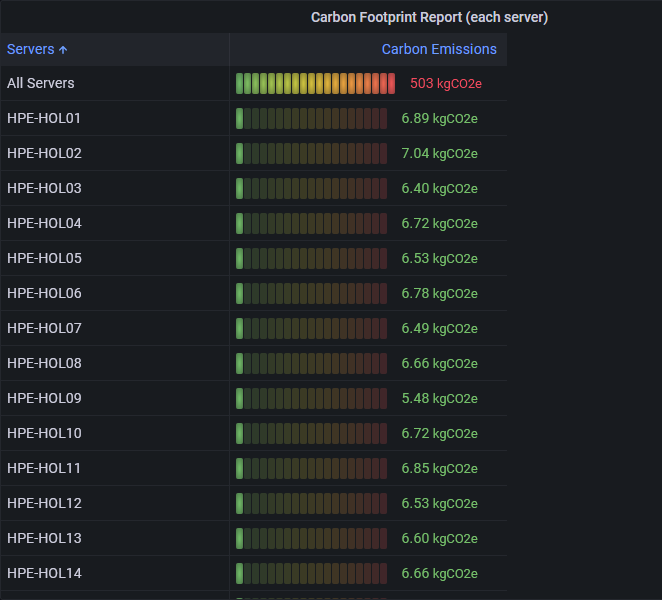
Carbon footprint report (each server)
This report displays the estimated total carbon emissions for each server.
Panel overview
API request
get /compute-ops/v1beta1/reports/{id}/data
API response
  "id": "843023bd-9412-46c2-8ac2-a3691f657fdb",
  "type": "compute-ops/report-data",
  "name": "Carbon Footprint Report (All Servers)",
  "request": {
    "reportDataStartAt": "2022-02-04T01:04:20+00:00",
    "reportDataEndAt": "2022-02-11T01:04:20+00:00",
    "reportType": "CARBON_FOOTPRINT"
  },
  "series": [
    {
      "name": "Carbon Emissions",
      "type": "CO2_EMISSIONS",
      "units": "kgCO2e",
      "unitsDisplayName": "kilograms of carbon dioxide equivalent",
      "subject": {
        "displayName": "1M512501AB",
        "id": "875765-S01+1M512501AB",
        "type": "SERVER"
      },
      "summary": {
        "avg": 6.4,
        "sum": 6.4
      },
      "bucketDurationInSec": 86961.3,
      "expectedSamplesPerBucket": 289.9,
      "buckets": [
        {
          "timestamp": "2019-08-24T14:15:22Z",
          "value": 6.4,
          "numSamples": 233,
          "noValueReason": null,
          "extrapolated": 8
        }
      ]
    }
  ]
}
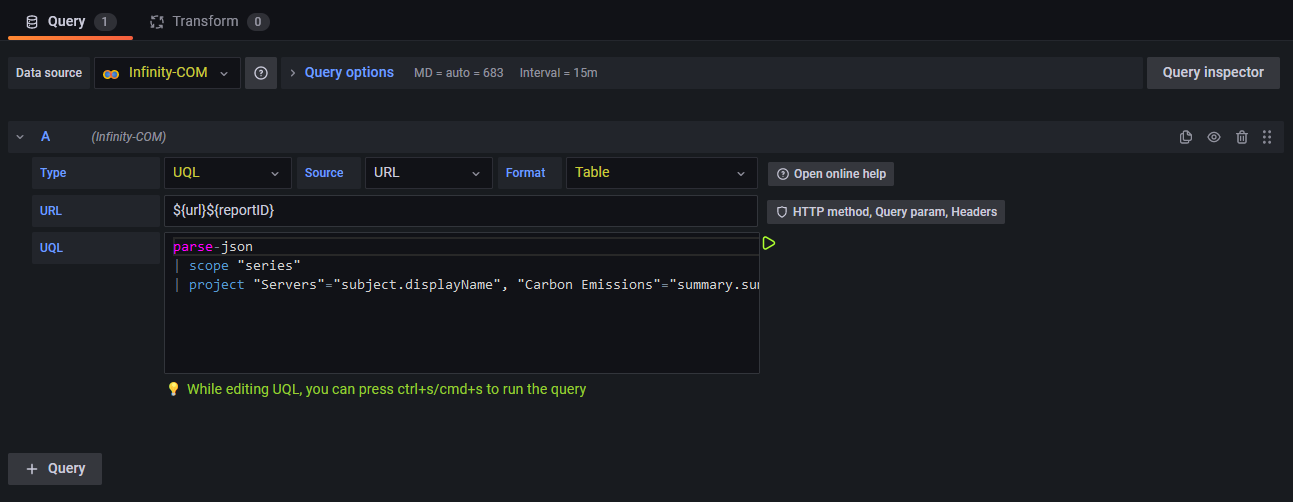
Panel configuration
- Data source: Infinity-COM
- Type: UQL
- Format: Table
- URL: ${url}${reportID}
- Method: GET
- Header name: Authorization
- Header value = Bearer ${session}
UQL:
parse-json
| scope "series"
| project "Servers"="subject.displayName", "Carbon Emissions"="summary.sum"Description of the UQL commands:
- parse-json: command to instruct UQL to parse the response as JSON
- scope: command to set
seriesas the output data - project: command to create a table with two columns (Servers and Carbon Emissions)
- Override1: Fields with name = Carbon Emissions / Cell display Mode = LCD Gauge
- Visualization: Table
- Unit: kgCO2e
- Color scheme: Green-Yellow-Red (by value)
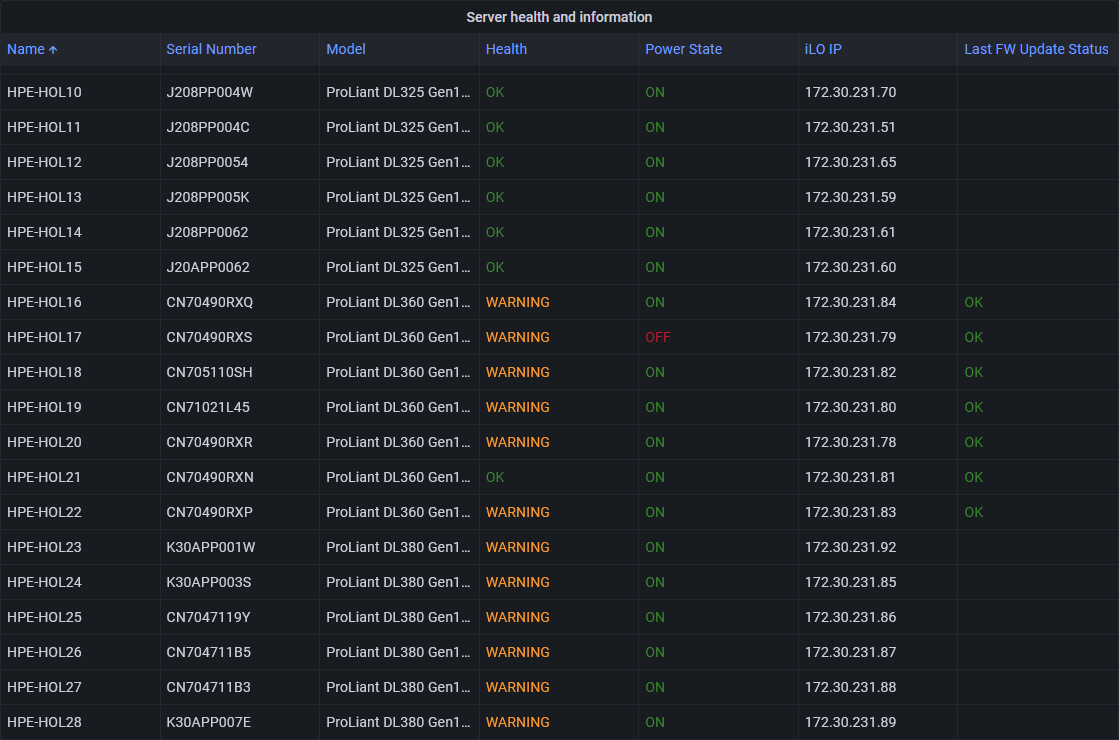
Server health and information panel
This panel displays the health and information for each server. The information you want to display in the panel is very flexible, many properties are available in servers resource, such as server model, serial number, model, power status, etc.
Panel overview
API request
get /compute-ops/v1beta2/servers/
API response
    "id": "P39886-B21+CN70490RXS",
    "type": "compute-ops/server",
    "platformFamily": "PROLIANT",
    "resourceUri": "/compute-ops/v1beta2/servers/P39886-B21+CN70490RXS",
    "name": "HPE-HOL17",
    "createdAt": "2022-03-25T16:22:22.373640+00:00",
    "updatedAt": "2022-10-19T20:18:08.466399+00:00",
    "generation": 515,
    "hardware": {
        "serialNumber": "CN70490RXS",
        "model": "ProLiant DL360 Gen10 Plus",
        "uuid": "38393350-3638-4E43-3730-343930525853",
        "productId": "P39886-B21",
        "powerState": "OFF",
        "indicatorLed": "OFF",
        "health": {
            "summary": "WARNING",
            "healthLED": "WARNING",
            "fans": "OK",
            "fanRedundancy": "REDUNDANT",
            "liquidCooling": "NOT_PRESENT",
            "liquidCoolingRedundancy": "NOT_PRESENT",
            "memory": "OK",
            "network": "UNKNOWN",
            "powerSupplies": "OK",
            "powerSupplyRedundancy": "NOT_PRESENT",
            "processor": "OK",
            "storage": "OK",
            "temperature": "OK",
            "bios": "WARNING",
            "smartStorage": "OK"
        },
        "bmc": {
            "mac": "B4:7A:F1:54:71:68",
            "ip": "172.30.231.79",
            "hostname": "None"
        }
    },
    "state": {
        "managed": true,
        "connected": true,
        "connectedModifiedAt": "2022-10-18T17:38:10.624330+00:00",
        "subscriptionState": "SUBSCRIBED",
        "subscriptionTier": "Enhanced",
        "subscriptionExpiresAt": "2027-01-31T19:11:00+00:00"
    },
    "firmwareInventory": [
        {
            "name": "iLO 5",
            "version": "2.72 Sep 04 2022",
            "deviceContext": "System Board"
        },
       ,
        {
            "name": "8 SFF 12G x1SAS UBM2 BC BP",
            "version": "1.20",
            "deviceContext": "Slot=12:Port=2I:Box=1"
        }
    ],
    "softwareInventory": [],
    "lastFirmwareUpdate": {
        "status": "OK",
        "attemptedAt": "2022-10-19T20:12:03.401750Z",
        "firmwareInventoryUpdates": [
            {
                "name": "U46_1.64_08_11_2022.fwpkg",
                "version": "1.64_08-11-2022",
                "status": "OK"
            },
            <...>
            {
                "name": "cp053854.exe",
                "version": "5.32",
                "status": "OK"
            }
        ]
    },
    "host": {
        "osName": "None",
        "osVersion": "None",
        "hostname": "HPE-HOL17",
        "osType": null,
        "osDescription": "None"
    },
    "firmwareBundleUri": "/v1/firmware-bundles/ea469b39ed5106434169397999e816bf",
    "tags": {},
    "biosFamily": "U46",
    "processorVendor": "Intel(R) Xeon(R) Gold 6338 CPU @ 2.00GHz",
    "autoIloFwUpdate": true
}
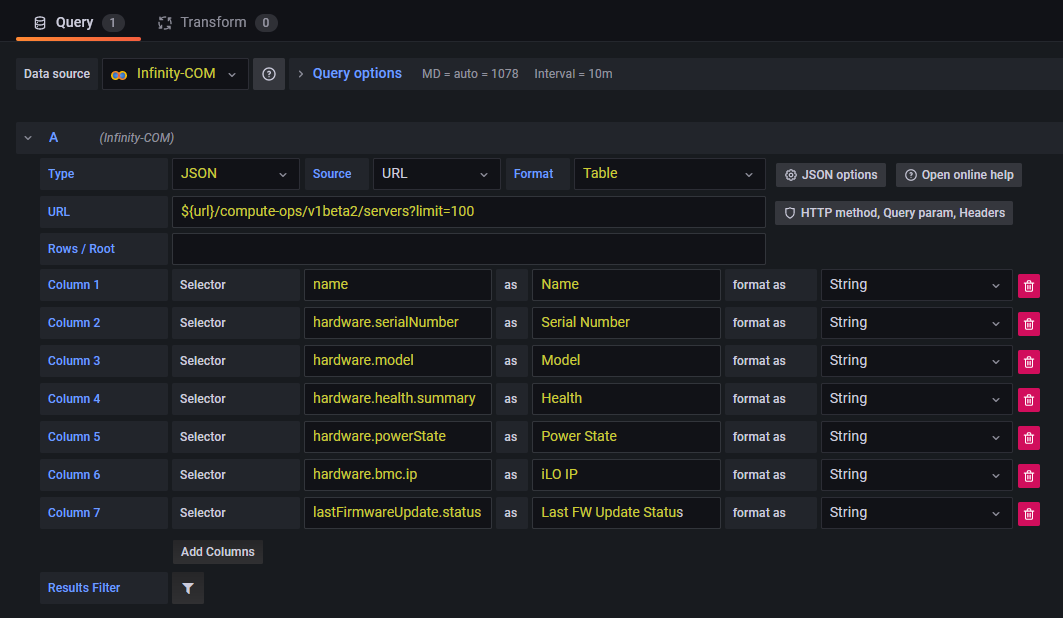
Panel configuration
- Data source: Infinity-COM
- Type: JSON
- Format: Table
- URL: ${url}/compute-ops/v1beta2/servers?limit=100
- Method: GET
- Header name: Authorization
- Header value = Bearer ${session}
- Column 1: name as Name
- Column 2: hardware.serialNumber as Serial Number
- Column 3: hardware.model as Model
- Column 4: hardware.health.summary as Health
- Column 5: hardware.powerState as Power State
- Column 6: hardware.bmc.ip as iLO IP
- Column 7: lastFirmwareUpdate.status as Last FW Update Status
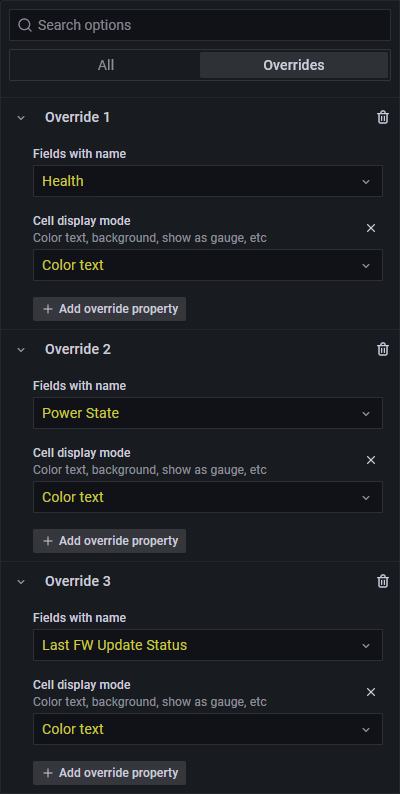
- Override1: Fields with name = Health / Cell display Mode = Color text
- Override2: Fields with name = Power State / Cell display Mode = Color text
- Override3: Fields with name = Last FW Update Status / Cell display Mode = Color text
- Visualization: Table
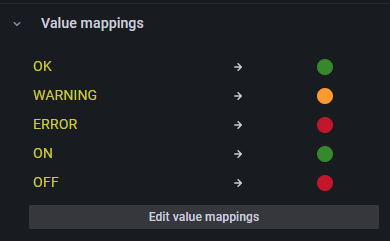
- Value mappings:
- OK: Green
- WARNING: Orange
- ERROR: Red
- ON: Green
- OFF: Red
Many other panels using other API resources can be generated, for example for firmware bundles, groups, activities, etc. And now you have all the basics to get started and create the panels you need in your environment.
This concludes this blog post. I hope you find it useful and should you have any feedback, please send me a message.
Tags
Related

Automating IT Operations with Compute Ops Management Webhooks
May 3, 2024Explore HPE GreenLake for Compute Ops Management REST API using cURL and Postman
Nov 30, 2022Explore the HPE GreenLake for Compute Ops Management REST API using Python and PowerShell
Dec 1, 2022
Getting started with HPE GreenLake Compute Ops Management API in just 3mn
Jan 4, 2023
How to use an API access token for HPE GreenLake for Compute Ops Management
Oct 27, 2022
Streamline your server deployments: Bare metal provisioning with HPE GreenLake for Compute Ops Management and Ansible
Feb 21, 2024