HPE GreenLake for Private Cloud Enterprise monitoring with Apache SkyWalking and OpenTelemetry
January 13, 2023Overview
Modern applications are predominantly distributed microservices-based applications that are flexible for scalability and developed using varying technology stacks. These applications are deployed on a highly available infrastructure composed of a multitude of compute instances (bare metal/virtual machine/container). It is imperative to monitor, in near real time, how the compute resources are utilized, so that necessary proactive actions are initiated to keep the applications in a consistently acceptable state. Application Performance Management (APM) tools help to centrally monitor distributed applications and/or compute resources.
Apache SkyWalking is a popular, open-source application performance monitoring (APM) tool used to collect, analyze, aggregate, and visualize data from services and cloud-native infrastructures. It provides an easy way to maintain a clear view of your distributed systems, even across clouds. You can use it with HPE GreenLake for Private Cloud Enterprise, the managed, pay-per-use Private Cloud as a Service (PCaaS) solution to enhance monitoring and observability of your workloads.
Because HPE GreenLake for Private Cloud Enterprise provides you with a flexible, self-service environment where you can implement a hybrid approach and run different kinds of bare metal, virtual machine, and containerized workloads, you can take advantage of additional apps and tools like SkyWalking to customize your situation and meet your specific needs.
In this post, I will focus on how you can use SkyWalking and OpenTelemetry or OTel for short, to do infrastructure host monitoring while taking advantage of how HPE GreenLake provides you with a consistent cloud experience across all your applications and data, whether on- or off-premises.
Let's get started
Definitions
- Monitoring is tooling or a technical solution that allows teams to watch and understand the state of their systems. Monitoring is based on gathering predefined sets of metrics or logs.
- Observability is tooling or a technical solution that allows teams to actively debug their system. Observability is based on exploring properties and patterns not defined in advance.
Pre-requisites
- An active service subscription to HPE GreenLake Private Cloud Enterprise.
- VM and/or Bare metal instances are provisioned for the workloads and you are able to log in to the console.
- SkyWalking instance has been setup either on premises or in Hyperscalers. Ensure that inbound ingress traffic is allowed on port 11800 for SkyWalking instance.
Steps to configure monitoring
Step 1- Monitoring host metric with node exporter
Log in to the console of machine to be monitored.
Next, download and run the node exporter using the snippet code below.
wget https://github.com/prometheus/node_exporter/releases/download/v1.4.0-rc.0/node_exporter-1.4.0-rc.0.linux-amd64.tar.gz

tar xvfz node_exporter-1.4.0-rc.0.linux-amd64.tar.gz

rm -rf node_exporter-1.4.0-rc.0.linux-amd64.tar.gz

cd node_exporter-1.4.0-rc.0.linux-amd64

cp node_exporter /usr/sbin

cat<<EOF >nodeexporter.service

[Unit]
Description=Service to start the node_exporter on the node
[Service]
Type=Simple
ExecStart=/usr/sbin/node_exporter
StandardOutput=syslog
StandardError=syslog
SyslogIdentifier=%n

[Install]
WantedBy=multi-user.target

EOF


mv nodeexporter.service /etc/systemd/system
systemctl daemon-reload
systemctl enable nodexporter.service
systemctl start nodexporter.service
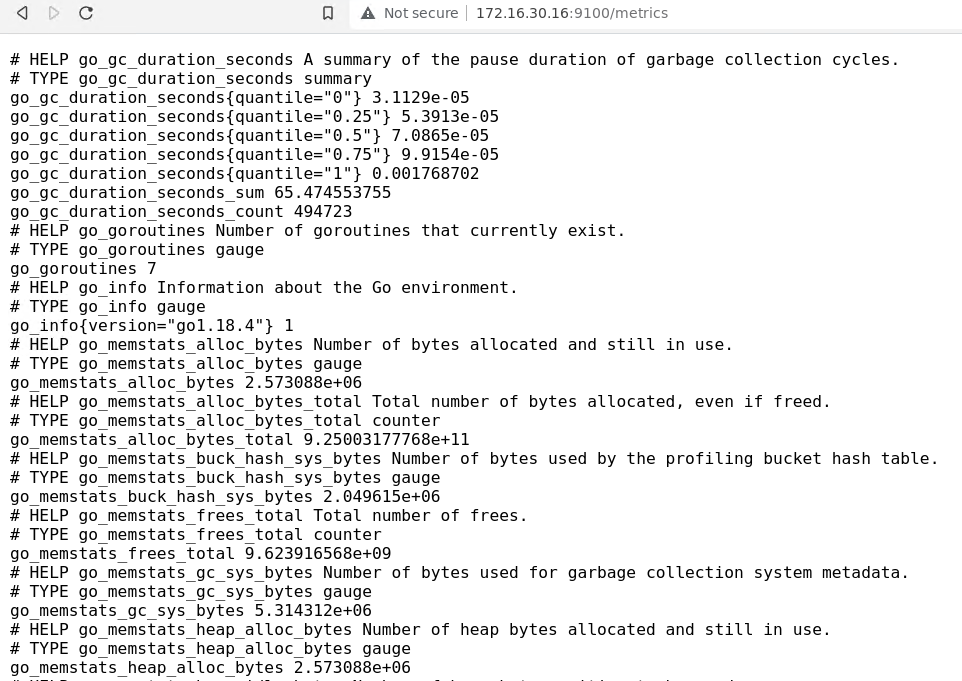
Check that the metrics endpoint shows metrics exported from the infrastructure node.
curl <http://localhost:9100/metrics>

Step 2- Setup OpenTelemetry (OTel) collector
OTel provides a set of standardized vendor-agnostic SDKs, APIs, and tools for ingesting, transforming, and sending data to an observability back-end. You can install OTel collector in the same host, which exposes metrics, or we can create central VM/Bare metal instance to receive telemetry information from several infrastructure instances.
Install OTel collector.
sudo wget <https://github.com/open-telemetry/opentelemetry-collector-releases/releases/download/v0.54.0/otelcol_0.54.0_linux_amd64.deb>

sudo dpkg -i otelcol_0.54.0_linux_amd64.deb

systemctl status otelcol

# By default, the otelcol systemd service will be started with the --config=/etc/otelcol/config.yaml option after installation.
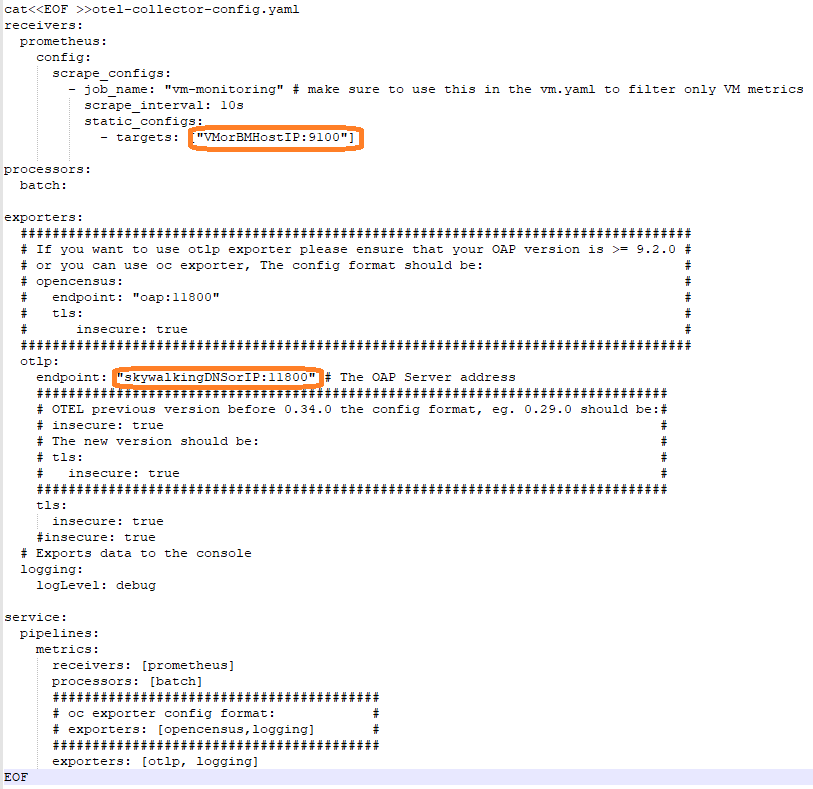
Create a new OTel configuration file (say /etc/otelcol/otel-collector-config.yaml) to link the metrics from host nodes to SkyWalking Observability Analysis Platform (OAP). The orange boxes shown in the images below must be modified to point to the correct infrastructure hosts and SkyWalking DNS or IP address.

Change the OTel configuration to the newly created OTel configuration file.
cd /etc/otelcol

sudo nano otelcol.conf

# Change the path to the new configuration file you just created in the
# above step and save.

sudo systemctl restart otelcol

sudo journalctl -u otelcol
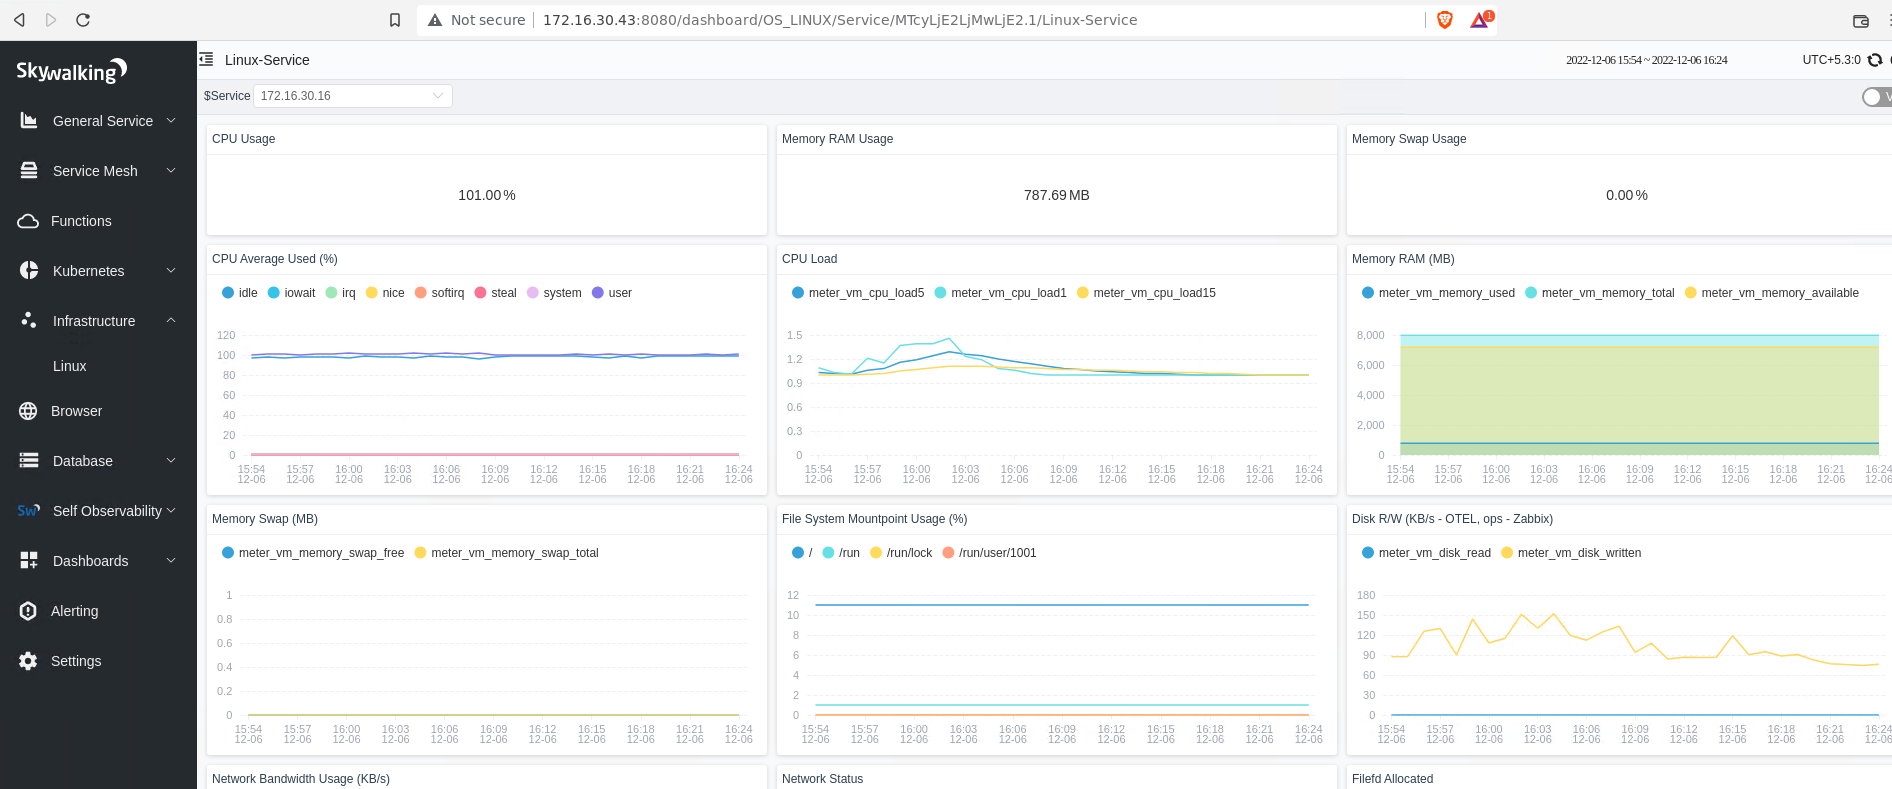
Step 3- Validate the infrastructure host metrics are seen in the SkyWalking UI

Conclusion
Infrastructure and application level monitoring gives a holistic picture of service reliability. In this post, I have shown you how easily you can set up compute infrastructure resource monitoring, running in on- or off-premises, using OpenTelemetry and SkyWalking. CPU, Memory, and Disk usage trends showin in the APM tool give the monitoring team early insights into potential system issues that should be addressed before they impact customer applications. Additionally, APM tools often provide trace, logs, metrics monitoring along with alerting, which can be used in conjunction with infrastructure monitoring tools to provide highly reliable services for customers.
Reference
Tags
Related

Handling application performance monitoring on HPE GreenLake for Private Cloud Enterprise – Part 1: A tools overview
Jan 9, 2023
Addressing hybrid cloud application challenges using HPE GreenLake for Private Cloud Enterprise – Part 2: Application monitoring
Jan 6, 2023
Handling application performance monitoring on HPE GreenLake for Private Cloud Enterprise – Part 2: App monitoring using Apache SkyWalking
Jan 10, 2023
Handling application performance monitoring on HPE GreenLake for Private Cloud Enterprise – Part 3: K8s monitoring using Apache SkyWalking
Jan 11, 2023A guide to enabling a managed Istio service mesh in a Kubernetes cluster on HPE GreenLake for Private Cloud Enterprise
Feb 16, 2023Using HPE GreenLake Console's API Gateway for Data Services Cloud Console
Nov 30, 2021Automate ITOps: announcing foundational APIs for the HPE GreenLake edge-to-cloud platform
Dec 1, 2023