Editor’s Note: MapR products and solutions sold prior to the acquisition of such assets by Hewlett Packard Enterprise Company in 2019, may have older product names and model numbers that differ from current solutions. For information about current offerings, which are now part of HPE Ezmeral Data Fabric, please visit https://www.hpe.com/us/en/software/data-fabric.html
Original Post Information:
"authorDisplayName": "Ian Downard",
"publish": "2018-07-26T10:45:00.000",
"tags": "use-case"
Anytime you have lat/long coordinates, you have an opportunity to do data science with k-means clustering and visualization on a map. This is a story about how I used geo data with k-means clustering on a topic that has affected me personally - wildfires!
Every summer wildfires become front of mind for thousands of people who live in the West, Pacific Northwest, and Northern Rockies regions of the United States. Odds are, if you don't see the flames first hand, you will probably see smoke influenced the weather, road closures, and calls for caution by local authorities.
I've lived in Oregon for about 10 years. In that time I've had more than one close encounter with a forest fire. The summer of 2017 was especially bad. A fire in the Columbia River Gorge blew smoke and ash through my neighborhood. Earlier in the year, I crossed paths with firefighters attempting to control a fire in steep rugged terrain in southern Washington. I was stunned to see the size of their equipment and trucks so badass they could be in a Mad Max movie.
Fire fighting is expensive! Wildland fire suppression costs exceeded $2 billion in 2017, making it the most expensive year on record for the U.S. Forest Service. Fires also have a tendency to explode in size. It's not at all unusual for fires to grow by 50,000 acres in one day when winds are high and the terrain is steep. Take a moment to conceptualize those numbers. $2 billion! More than 50,000 acres, burned in one day!
A Beckoning to Data Science
I focused my study on optimizing against the following two constraints:
- The cost it takes to move water tanks and other heavy equipment.
- The propensity for fires to explode in size if not suppressed quickly.
Both of these things can be minimized by staging equipment as close as possible to where fires are likely to occur.
The Problem
Minimize the cost and time to respond to fires by staging firefighting assets as close as possible to where fires are likely to occur.
The Solution

My goal is to predict where forest fires are prone to occur by partitioning the locations of past burns into clusters whose centroids can be used to optimally place water tanks and heavy fire fighting equipment as near as possible to where fires are likely to occur. The k-means clustering algorithm is aptly suited for this purpose.
The Data
The U.S. Forest Service provides datasets that describe forest fires that have occurred in Canada and the United States since the year 2000. That data can be downloaded from the Forest Service at https://fsapps.nwcg.gov/gisdata.php. For my purposes, this dataset is provided in an inconvenient shapefile format. It needs to be transformed to CSV in order to be easily analyzed with Apache Spark (no pun intended). Also, the records after 2008 have a different schema than prior years, so, after converting the shapefiles to CSV, they'll need to be ingested into Spark using separate user-defined schemas.
By the way, this complexity is typical. Raw data is hardly ever suitable for machine learning without cleansing. The process of cleaning and unifying messy data sets is called data wrangling, and it frequently comprises the bulk of the effort involved in real-world machine learning.
The Science

The data wrangling that precedes machine learning typically involves writing expressions in R, SQL, Scala, and/or Python to join and transform sampled datasets. Often, getting these expressions right involves a lot of trial and error. Ideally, you want to test those expressions without the burden of compiling and running a full program. Data scientists have embraced web-based notebooks such as Apache Zeppelin for this purpose because they allow you to interactively transform datasets and let you know right away if what you're trying to do will work properly.
The Zeppelin notebook I wrote for this study contains a combination of Bash, Python, Scala, and Angular code. A screenshot of the Zeppelin notebook I created for this study is shown here and the notebook file can be downloaded here. Essentially, I used Zeppelin to accomplish the following tasks:
- Download historical forest fire data
- Transform raw data into a desirable format
- Identify lat/long feature columns for k-means clustering
- Load data into Spark ML and train a k-means model
- Map the clusters showing regions where fires have been concentrated in the past
The code and documentation I wrote for this study is available here:
https://github.com/mapr-demos/mapr-sparkml-streaming-wildfires
Code Walkthrough
Here's the bash code I use to download the dataset:

Here's the Python code I used to convert the downloaded datasets to CSV files:

Here's the Scala code I use to ingest the CSV files and train a k-means model with Spark libraries:

The resulting cluster centers are shown below. Where would you stage fire fighting equipment?

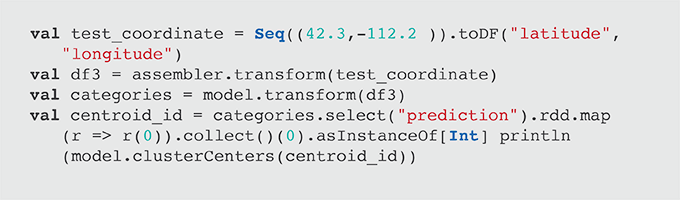
These circles were calculated by analyzing the locations for fires that have occurred in the past. These points can be used to help stage fire fighting equipment as near as possible to regions prone to burn, but how do we know which staging area should respond when a new forest fire starts? We can use our previously saved model to answer that question. The Scala code for that looks like this:
Operationalizing This Model as a Real-Time "Fire Response" App
The previous code excerpt shows how the model we developed could be used to identify which fire station (i.e., centroid) should be assigned to a given wildfire. We could operationalize this as a real-time fire response application with the following ML pipeline:

Most machine learning applications are initially architected with a synchronous pipeline like the one shown above, but there are limitations to this simplistic approach. Since it is only architected for a single model, your options are limited when it comes to the following:
- How do you A/B test different versions of your model?
- How do you load balance inference requests?
- How do you process inference requests with multiple models optimized for different objectives (e.g., speed versus accuracy)?
In order to do these things, the model must be a modular component in the pipeline, and model results should rendezvous at a point where they can be compared, monitored, and selected based upon user-defined criteria. This design pattern can be achieved with an architecture called the rendezvous architecture.
The Rendezvous Architecture
The rendezvous architecture is a machine learning pipeline that allows multiple models to process inference requests and rendezvous at a point where user-defined logic can be applied to choose which ML result to return to the requester. Such logic could say, "Give me the fastest result," or "give me the highest confidence score after waiting 10 seconds." The rendezvous point also gives us a point where models can be monitored and requests can be captured where model results significantly disagree with each other.

Note the emphasis on streams. Streams buffer requests in an infinite, resilient, and replayable queue. This makes it easy to hotswap models and scale ML executors in a microservices fashion. It also guarantees traceability for every inference request and response.
If you'd like to learn more about the rendezvous architecture, read the highly recommended Machine Learning Logistics by Ted Dunning and Ellen Friedman. It was published in 2017 and is available as a free downloadable eBook.
Conclusion
This was a story about how I used geo data with k-means clustering that relates to a topic that deeply affects a lot of people - wildfires! Anytime you have lat / long coordinates you have an opportunity to do data science with k-means clustering and visualization on a map. I hope this example illustrates the basics of k-means clustering and also gives some perspective on how machine learning models can be operationalized in production scenarios using streaming interfaces.
Related
3 ways a data fabric enables a data-first approach
Mar 15, 2022A Functional Approach to Logging in Apache Spark
Feb 5, 2021
Getting Started with DataTaps in Kubernetes Pods
Jul 6, 2021